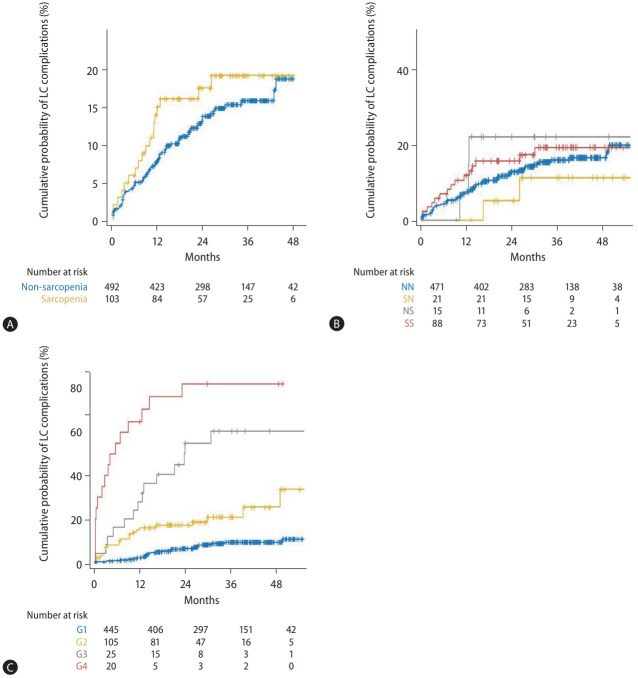
Figure 3.
Kaplan-Meier plots for the development of cirrhosis complication after 1-year CT. The development of cirrhosis complication was not well-stratified by (A) the sarcopenia status and (B) sarcopenia status change (P=0.30 and 0.73, respectively). However, based on (C) the four groups (G1–4) classified by Child-Pugh class and ΔSMI/yr%, it was well distinguished (P<0.001). LC, liver cirrhosis; NN, non- sarcopenia to non-sarcopenia; SN, sarcopenia to non-sarcopenia; NS, non-sarcopenia to sarcopenia; SS, sarcopenia to sarcopenia; G1, Child-Pugh class A and ΔSMI/yr% ≥-3.66; G2, Child-Pugh class A and ΔSMI/yr% <-3.66; G3, Child-Pugh class B/C and ΔSMI/yr% ≥-2.62; G4, Child-Pugh class B/C and ΔSMI/yr% <-2.62; CT, computed tomography; ΔSMI/yr%, % change in skeletal muscle index after 1 year.

