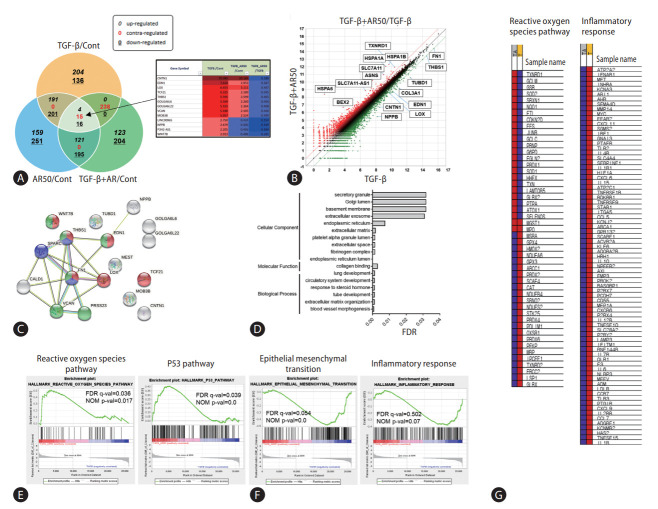
Figure 1.
Transcriptome analysis of auranofin in LX-2 cells. (A) Venn diagram with contrasting regulation of TGF-β1/Cont, TGF-β1+AR50/Cont, TGF-β1+AR50/TGF-β1 from transcriptome analysis. Genes regulated by auranofin treatment were expressed as a (B) scatter plot of TGF-β1+AR50/TGF-β1. Gene correlation was performed using a (C, D) string database tool. (E, F) GSEA analysis results of transcriptomes and their (G) heatmaps. TGF, transforming growth factor; FDR, false discovery rate; NOM, normalized enrichment score.

