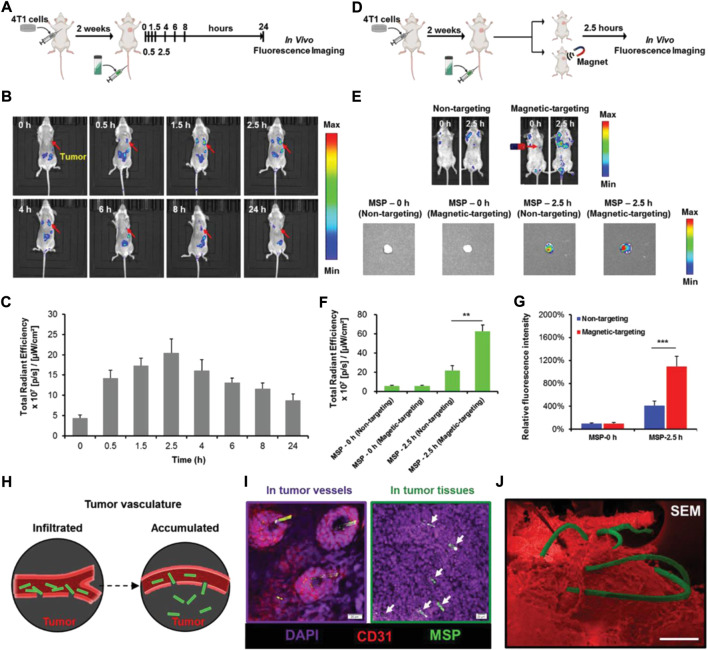
FIGURE 8.
In vivo tumor accumulation of magnetic S. platensis under the external magnetic field. (A) Schematic depiction of the establishment of orthotopic 4T1-bearing mice model and the biodistribution of magnetic S. platensis in vivo. (B) In vivo time-dependent representative fluorescence imaging of 4T1-bearing mice post intravenous injection of magnetic S. platensis without external magnetic field. (C) Quantitative analysis of fluorescence intensities at 0.5, 1.5, 2.5, 4, 6, 8, and 24 h post i.v. injection of magnetic S. platensis. (D) Schematic depiction of orthotopic 4T1-bearing mice model and the targeting ability of magnetic S. platensis in vivo. (E) Representative fluorescence imaging of 4T1-bearing mice after intravenous injection of magnetic S. platensis at predetermined time. (F) Quantitative analysis of fluorescence intensities of a solid tumor. (G) Quantitative analysis of the mean fluorescent intensities of dissected tumors. (H) Schematic depiction of the infiltration and accumulation of magnetic S. platensis at tumor sites. (I) Tumor stained with DAPI (nuclei: purple) and CD31 (vessels: red). The green signals: magnetic S. platensis. Scale bar: 20 µm. (J) Representative SEM image of magnetic S. platensis (green) accumulating in tumor (red). Scale bar: 100 µm. Reproduced with permission from Zhong et al. (2020). Copyright 2020, John Wiley and Sons.

