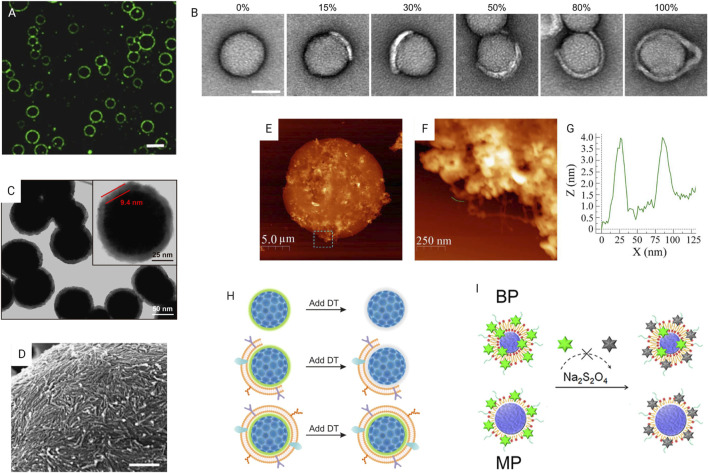
FIGURE 5.
Characterization of surface modification. (A) Confocal fluorescence microscopy image of lysozyme fibril-coated w/w emulsion droplets. Scale bar, 20 mm by Song et al. (2016) licensed under CC BY 4.0. (B) TEM images of CM-coated NPs with different coating percentages. Scale bar, 50 nm (Liu et al., 2021) licensed under CC BY 4.0. (C) TEM image of RBCM-coated NPs with enlarged image showing thickness of the coating; Reprinted with permission from Rao et al. (2017). Copyright 2017 American Chemical Society. (D) SEM image showing accumulation of nanofibrils in a self-assemble coating. Scale bar, 500 nm by (Song et al., 2016) licensed under CC BY 4.0. (E) AFM image showing the surface texture of a hydrogel-outgrown proteinosome with the (F) magnified image of the dashed box area marked in (E) showing outgrown hydrogel filaments and (G) corresponding height profile measured by AFM to determine filament thickness of 2–4 nm by (Mu et al., 2021) licensed under CC BY 4.0. (H) Fluorescence quenching assay of quantifying fully coated particle percentage by Liu et al. (2021) licensed under CC BY 4.0. (I) Fluorescence quenching method using NBD-labeled lipid-PLGA NPs to verify the lipid shell structure. Reprinted with permission from Zhang et al. (2015). Copyright 2015 American Chemical Society.

