Figure 2.
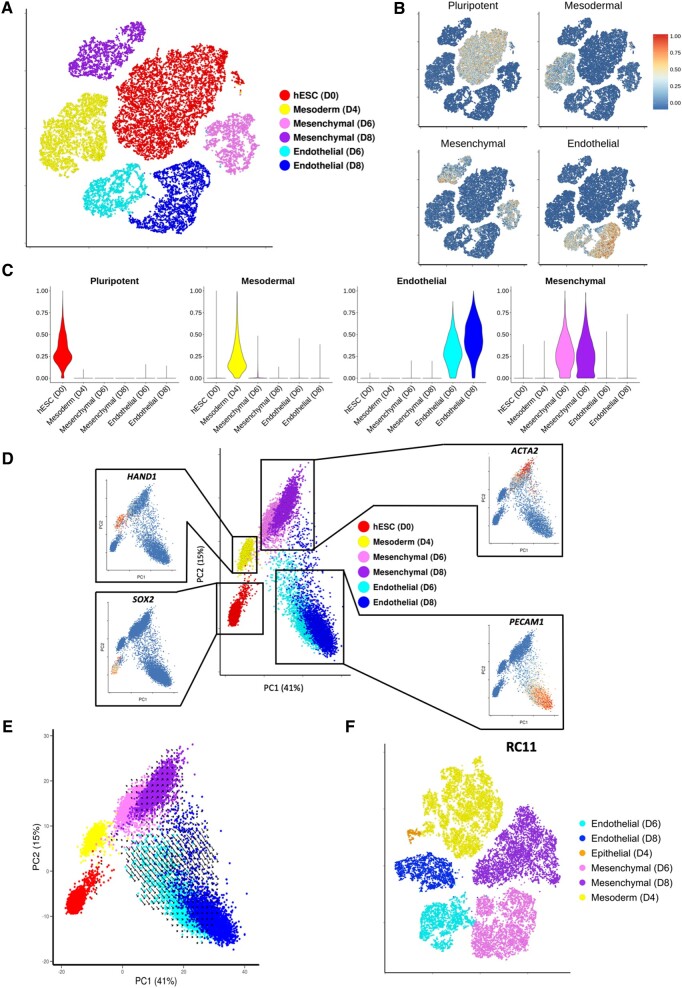
Single-cell RNA sequencing analysis across all time points mapping the transcriptional changes and predicted future direction of cells undergoing human embryonic stem cells-derived endothelial cell product differentiation. (A) tSNE plot constructed using data from 21 369 cells taken at Day 0, 4, 6, and 8 during H9 to human embryonic stem cells-derived endothelial cell product differentiation. Cluster identity determined by the expression of known pluripotent (SOX2), mesodermal (HAND1), mesenchymal (ACTA2), and endothelial markers (PECAM1). (B) Cell signature scores shown on tSNE plot from A. (C) Cell signature scores within identified clusters from A. (D) Principal component analysis plot containing cells taken at the four time points during H9 differentiation. Feature plots show key marker gene expression. (E) RNA velocities visualized on the principal component analysis plot from D. (F) tSNE plot using data from d4, d6, and d8 during differentiation of RC11.

