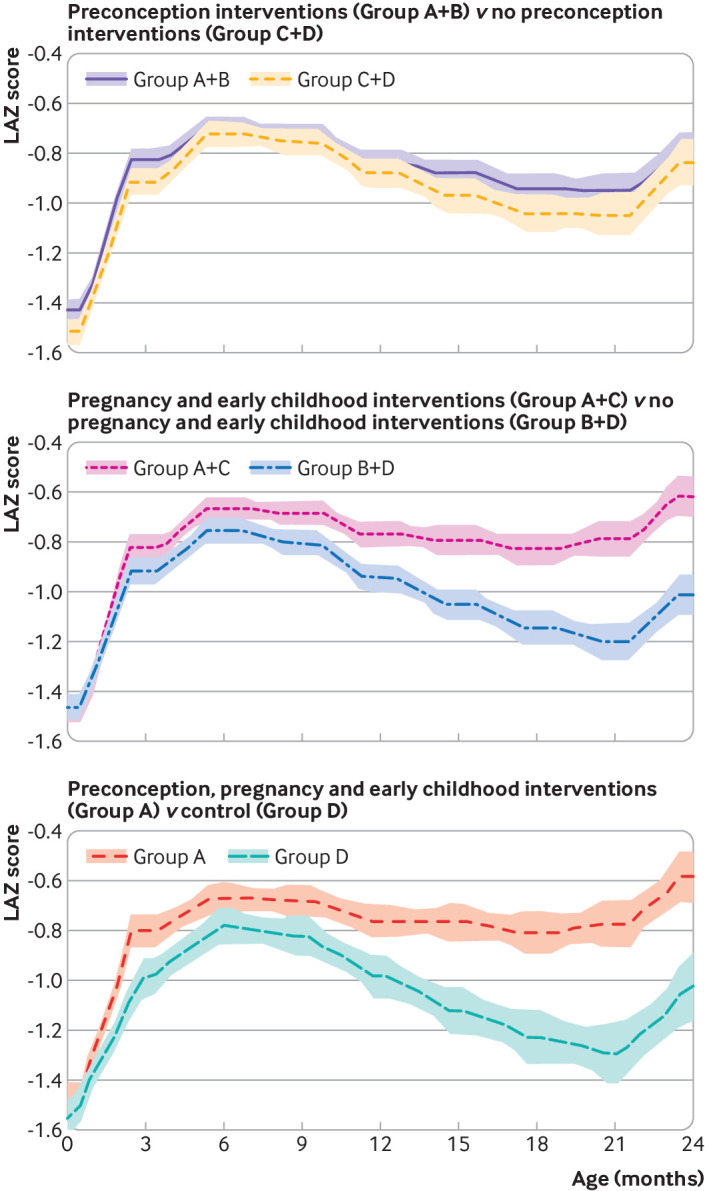
Fig 2.

Mean length-for-age z (LAZ) scores from birth to 24 months; cross sectional data, shaded areas 95% confidence intervals. Group A: preconception, pregnancy and early childhood intervention; group B: only preconception intervention; group C: only pregnancy and early childhood intervention; group D: control. Upper panel, numbers at each age: group A+B—2263 at 0 month, 2219 at 3 months, 2259 at 6 months, 2058 at 9 months, 1874 at 12 months, 1563 at 15 months, 1298 at 18 months, 1061 at 21 months, 892 at 24 months; group C+D—1916 at 0 month, 1860 at 3 months, 1867 at 6 months, 1623 at 9 months, 1061 at 12 months, 1128 at 15 months, 887 at 18 months, 709 at 21 months, 564 at 24 months. Middle panel, numbers at each age: group A+C—2138 at 0 month, 2077 at 3 months, 2113 at 6 months, 1888 at 9 months, 1675 at 12 months, 1360 at 15 months, 1107 at 18 months, 903 at 21 months, 746 at 24 months; group B+D—2041 at 0 month, 2002 at 3 months, 2013 at 6 months, 1793 at 9 months, 1608 at 12 months, 1331 at 15 months, 1078 at 18 months, 867 at 21 months, 710 at 24 months. Lower panel, numbers at each age: group A—1161 at 0 month, 1137 at 3 months, 1160 at 6 months, 1053 at 9 months, 953 at 12 months, 787 at 15 months, 658 at 18 months, 540 at 21 months, 453 at 24 months; group D—939 at 0 month, 920 at 3 months, 914 at 6 months, 788 at 9 months, 687 at 12 months, 555 at 15 months, 438 at 18 months, 346 at 21 months, 271 at 24 months
