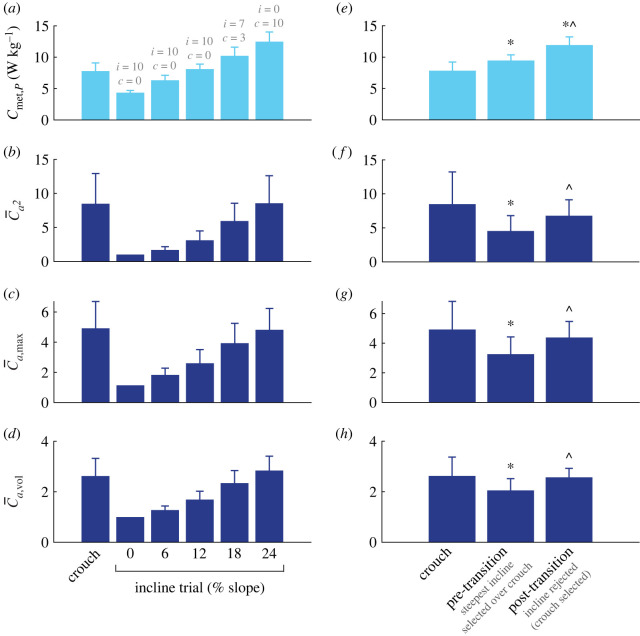
Figure 2.
Walking data for the (a–d) mean (±s.d.) crouch trial and five levels of incline (from 0 to 24%) and (e–h) mean (±s.d.) crouch trial and pre- and post-transition inclines. (a–e) Metabolic power (Cmet,P; W kg−1; n = 10), (b,f) mean of squared activations (; unitless; n = 8), (c,g) maximal muscle activation (; unitless; n = 8), and (d,h) volume-weighted muscle activations (; unitless; n = 8). The number of participants that selected incline (i) or crouch (c) in each condition are indicated in (a) (grey text). *Significantly different (p < 0.017) from crouch (e–h only); ^Significantly different (p < 0.017) from pre-transition (e–h only). (Online version in colour.)

