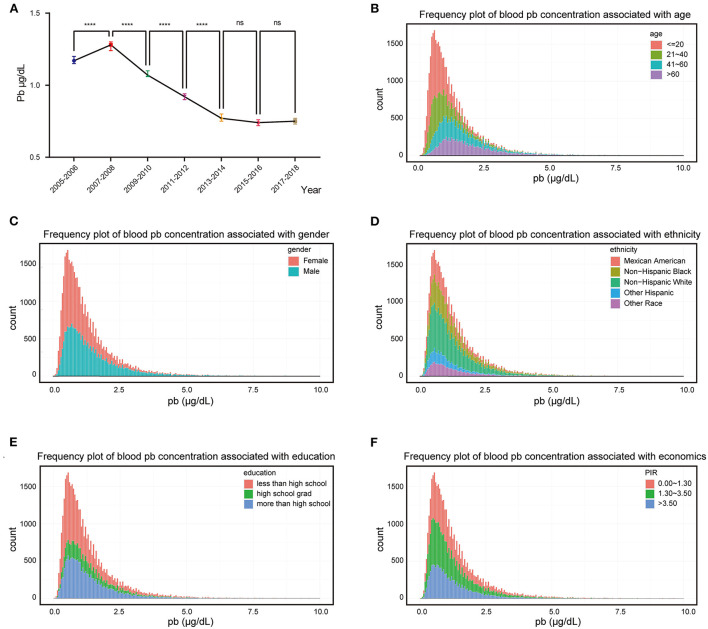
Figure 1.
Exposure patterns in the US. (A) Median blood lead concentration in the population for each survey cycle, bars represent 95% confidence interval; (B–F) Frequency distributions of blood lead concentrations were plotted and merged with demographic characteristics. ****p-value < 0.0001; ns, no significant.

