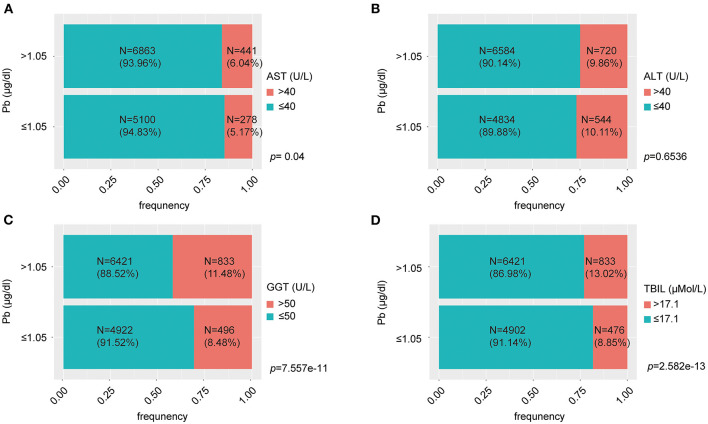
Figure 3.
The percent bar charts reflect proportion of normal and abnormal liver function at different levels of lead exposure. (A) The group with blood lead concentration >1.5 μg/dl had a greater proportion of individuals with AST > 40 U/L; (B) There was no significant difference in the proportion of individuals with ALT > 40 U/L between the high and low blood lead concentration groups; (C) The group with blood lead concentration >1.5 μg/dl had a greater proportion of individuals with GGT > 50 U/L; (D) The group with blood lead concentration > 1.5 μg/dl had a greater proportion of individuals with TBIL > 17.1 μMol/L.

