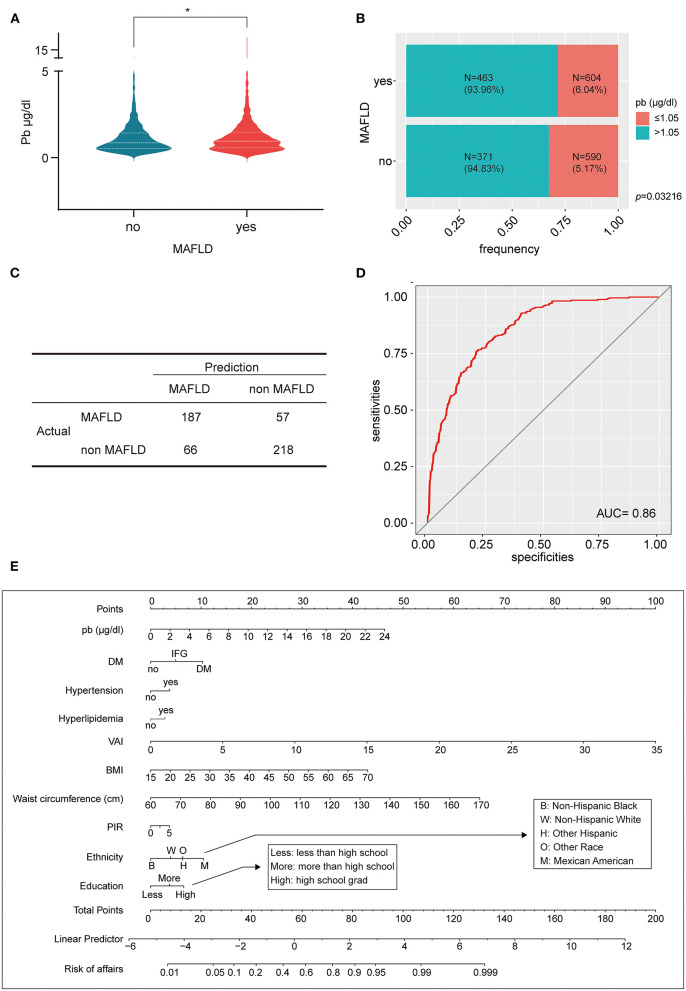
Figure 4.
Lead affects the development of MAFLD. (A) The violin plot reflects that MAFLD had higher blood lead concentration than non-MAFLD; (B) The percent bar chart reflects that the MAFLD group a greater proportion of individuals with blood lead concentration >1.5 μg/dl; (C) The four-grid table shows the difference between the predicted value and the actual value of the multifactorial logistic regression model in the validation set. (D) The ROC curve evaluated the effectiveness of multifactorial logistic regression model, AUC = 0.86; (E) A lead exposure related nomogram for MAFLD prevalence. *p-value < 0.05.

