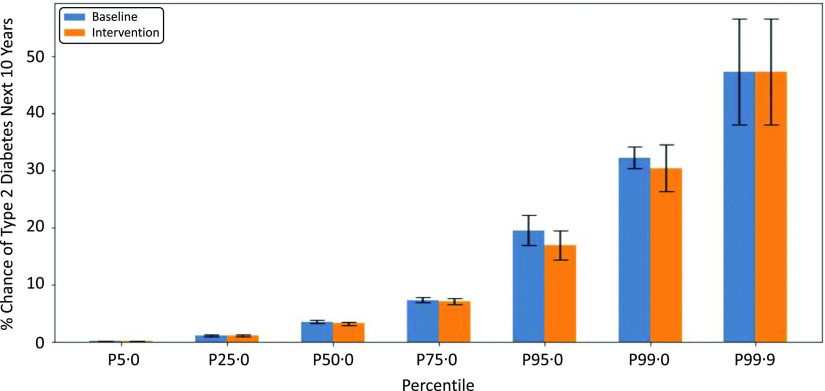
Fig. 2.
Type 2 diabetes risk (10-year percentage chance) percentiles. Fibre enrichment ‘Intervention’ scenario in blue and ‘Baseline’ in orange. The greatest change between baseline and intervention is observed at the higher percentiles, indicating those most at risk at baseline will benefit the most from fibre enrichment in terms of diabetes risk in the post-intervention scenario (n 1183).

