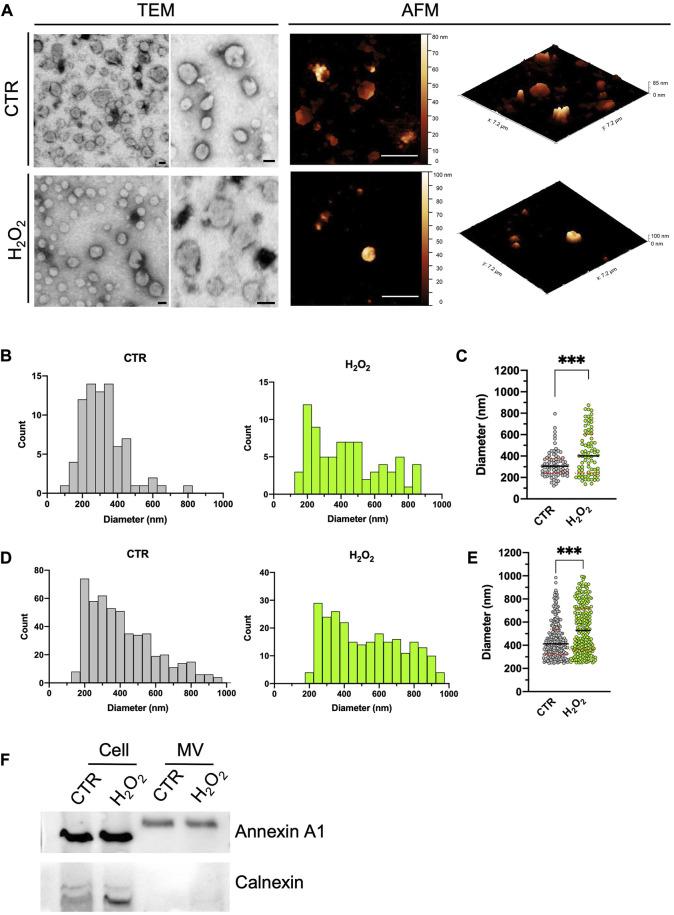
FIGURE 2.
Comparison between STEM and AFM imaging on isolated vesicles. (A): two typical STEM (left, scale bar 100 nm) and AFM (right, scale bar 2 µm) images acquired on isolated budding vesicles derived from control (first row) and H2O2 treated cells (second row). For each AFM image is also shown in its native 3D-view to better highlight the shape of the vesicles. (B) to (E): statistical analysis of the size distribution of the vesicles as measured with the STEM (B,C) and AFM (D,E) performed of vesicles derived from control (grey values) and H2O2 treated cells (green values). A direct comparison between the two size distributions is shown for STEM [(C), median diameter of 305 ± 14 nm for the vesicles derived from control cells and 401 ± 24 nm for the ones derived from H2O2-treated cells] and AFM [(E), median diameter of 412 ± 10 nm for the vesicles derived from control cells and 528 ± 13 nm for the ones derived from H2O2-treated cells] data. For both techniques the obtained distributions are statistically different (p < 0.05). (F): SDS-PAGE gel electrophoresis showing the presence of Annexin A1 (microvesicles marker) and calnexin (endoplasmic reticulum marker).

