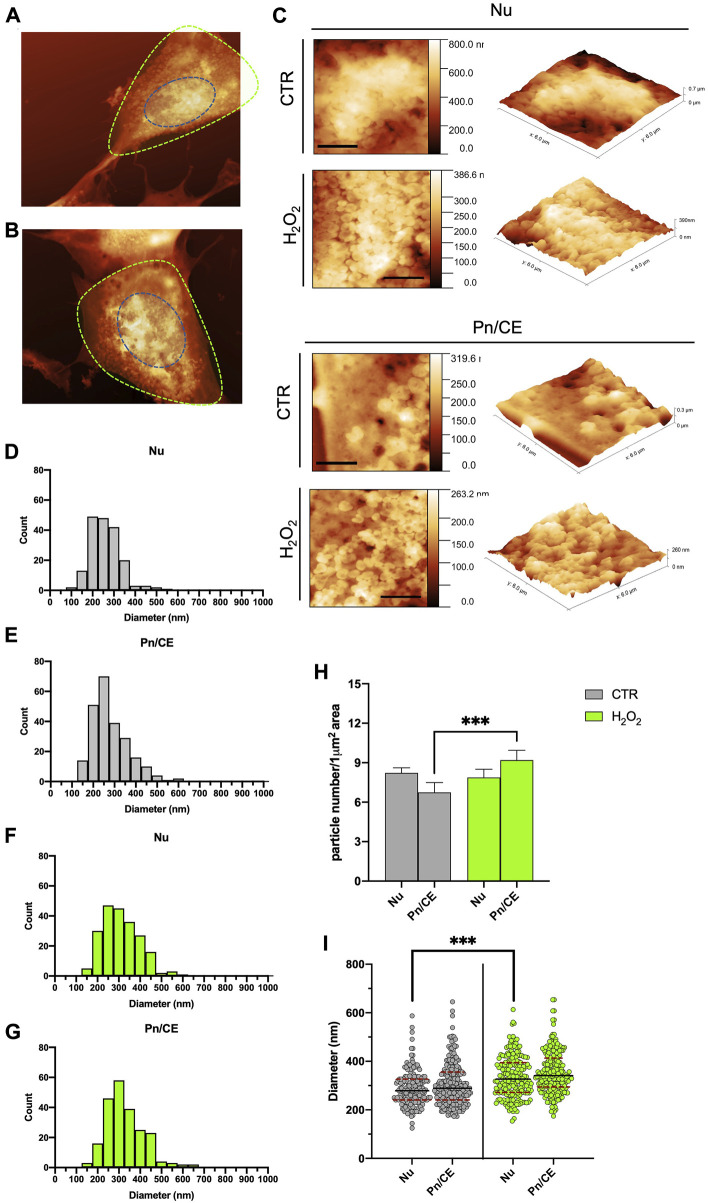
FIGURE 3.
Statistical analysis of the spatial distribution of the budding vesicles on the cells, as seen with AFM. (A) and (B) example of the segmentation of the AFM images in nuclear (Nu, blue dotted line) and perinuclear (Pn/CE, green dotted line) for one control (A) and one H2O2 treated (B) cell. (C) typical high resolution 2D (left, scale bars 2 µm) and 3D (right) zoom of a 6 × 6 micron areas of the control and H2O2 treated cells in the Nuclear (top panels) and perinuclear (bottom panels) used for the manual counting and diameter measurements of the vesicles. (D) to (G) size distributions of the vesicles separated according to the sampling region [nuclear (E,F), perinuclear (E,G) and the treatment (control cells showed in grey and H2O2 cells showed in green]. (H) comparison among the obtained data in terms of density of vesicles (i.e., number of vesicles measured for 1 µm2), the results obtained in the perinuclear areas of control and H202 treated cells are statistically different (p < 0.05). (I) direct comparison between the diameter distributions obtained for control (grey dots) and H202 treated (green dots) cells. The average diameter value obtained for the control cells are 279 ± 5 nm and 289 ± 6 nm in the nuclear and perinuclear regions, respectively, while for the H2O2 treated ones the corresponding values are 327 ± 6 nm and 341 ± 6 nm. The average diameters values in the nuclear regions were statistically different (p < 0.05) between control and H2O2 treated cells.

