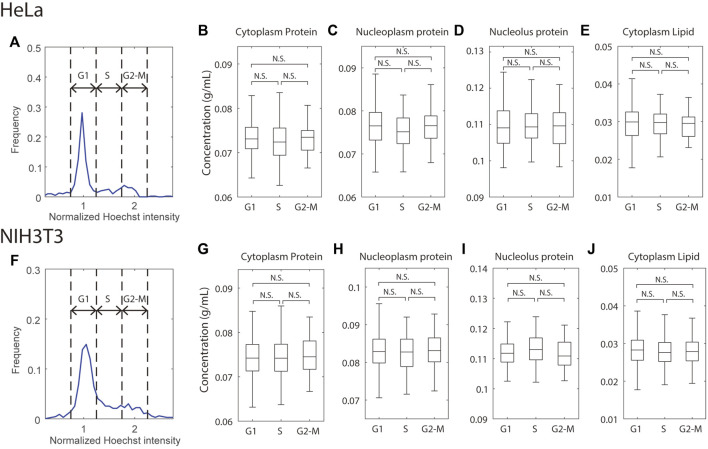
FIGURE 3.
Mass densities are independent of the cell cycle. (A,F) Histogram of total Hoechst intensity in the nucleus in cycling HeLa (A) or NIH3T3 (F) cells; the Hoechst intensity was normalized to the G1 peak of the distribution. Dashed lines indicate the gates for G1, S, and G2-M cells. (B–E,G–J) Mass densities in HeLa (B–E) and NIH3T3 (G–J) cells, grouped by the cell cycle stages. n = 250 (HeLa G1), 53 (HeLa S), 53 (HeLa G2-M), 392 (NIH3T3 G1), 123 (NIH3T3 S), 95 (NIH3T3 G2-M).

