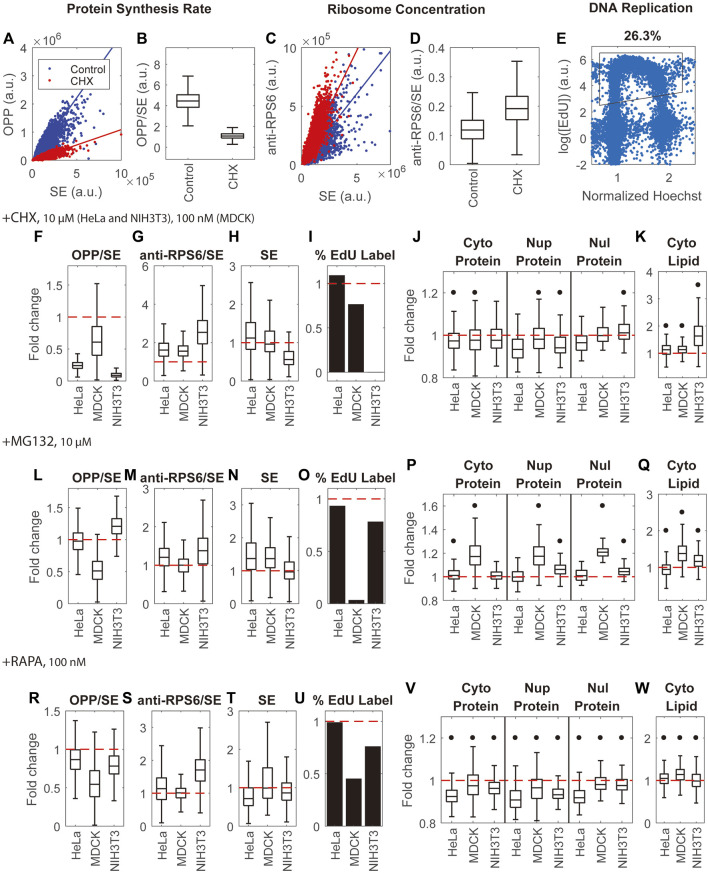
FIGURE 6.
Inhibition of protein synthesis, protein degradation, and mTOR activity have little effect on mass density. (A,B) Quantification of protein synthesis rate by the ratio of OPP pulse label to SE protein stain (OPP/SE) demonstrated by untreated HeLa cells and HeLa cells treated by Cycloheximide (CHX). Solid lines in (A) are y = kx, where k is the median of the OPP to SE ratio. (C,D) Quantification of ribosome concentration by the anti-RPS6 immunostain to SE protein stain ratio (anti-RPS6/SE) demonstrated by untreated HeLa cells and HeLa cells treated by CHX. Solid lines in (C) are y = kx, where k is the median of the anti-RPS6 to SE ratio. (E) Quantification of DNA replication by EdU labeling in untreated HeLa cells. The X-axis is the nuclear Hoechst intensity normalized by the highest peak of Hoechst distribution. The Y-axis is the logarithm of mean intensity of EdU in the nucleus. Each blue dot is a cell. The black outline is the gate for EdU label cells. (F–I) Fold change of protein synthesis rate (OPP/SE) (F), ribosome concentration (anti-RPS6/SE) (G), cell dry mass (SE) (H), and DNA replication (percentage of EdU labeled cells) (I) in CHX treated cells (J,K) Fold change of protein densities (J) and cytoplasmic lipid density (K) in CHX treated cells. (L–O) Fold change of protein synthesis rate (OPP/SE) (L), ribosome concentration (anti-RPS6/SE) (M), cell dry mass (SE) (N), and DNA replication (percentage of EdU labeled cells) (O) in MG132 treated cells. (P,Q) Fold change of protein densities (P) and cytoplasmic lipid density (Q) in MG132 treated cells. (R–U) Fold change of protein synthesis rate (OPP/SE) (R), ribosome concentration (anti-RPS6/SE) (S), cell dry mass (SE) (T), and DNA replication (percentage of EdU labeled cells) (U) in Rapamycin (RAPA) treated cells. (V,W) Fold change of protein density (V) and cytoplasmic lipid density (W) in Rapamycin treated cells. (F–W) are normalized to the median of untreated cells. Red dashed lines in (F–W) indicate fold change = 1 (no change). Black dots in (J–K,P–Q,V–W) denote significant changes over controls. The absolute changes and representative NoRI images are in Supplementary Figures S10–12. Drug concentrations used in this assay are 100 nM cycloheximide for MDCK cells, 10 µM cycloheximide for HeLa and NIH3T3 cells, and 10 µM MG132 and 100 nM Rapamycin for all 3 cell lines.

