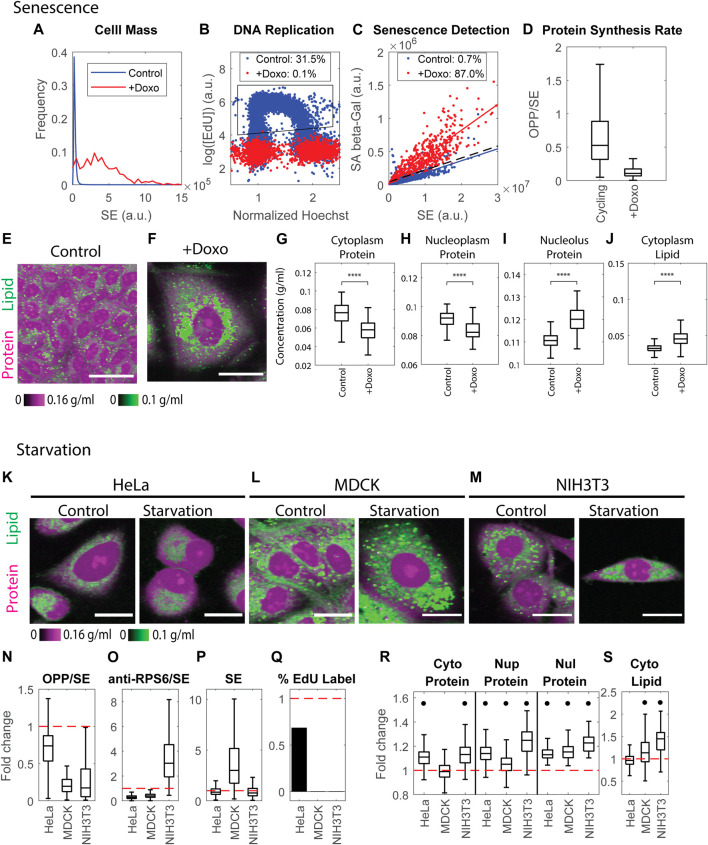
FIGURE 7.
Cell senescence and quiescence change mass densities dramatically. (A) Cell mass distributions quantified by the SE protein stain in untreated MDCK cells and MDCK cells treated with 100 ng/ml Doxorubicin for 5 days. n = 26391(Control), n = 523 (+Doxo). (B) DNA replication detected by EdU incorporation in untreated MDCK cells and MDCK cells treated with 100 ng/ml Doxorubicin for 5 days. n = 17816 (Control), n = 1939 (+Doxo). Legends indicate the percentage of cells in the gated region (black polygon) of EdU incorporation. (C) Senescent cells detected by SA-β-galactosidase activity vs. SE protein stain. Each dot is an individual cell. Solid colored lines are the linear fit of the correlation. The dashed black line y = ax + 3b is the threshold used to detect senescent cells, where a is the slope of the linear fit of the control correlation, and b is the Root Mean Square Error (RMSE) of the fit. Legends indicate the percentage of senescent cells detected by this threshold. (D) Protein synthesis rate quantified by the OPP/SE ratio in cycling cells (Control n = 20481), and senescent cells (+Doxo n = 1134). (E,F) Protein and lipid concentration image of cycling (E) and senescent (F) MDCK cells. Scale bar is 40 µm. (G–J) Cytoplasmic protein density (G), nucleoplasm protein density (H), nucleolus protein density (I), and cytoplasm lipid density (J) in senescent MDCK cells (+Doxo n = 112), compared to cycling cells (Control n = 1169). (K–M) Representative NoRI images of control and 0.1% serum-starved HeLa (K), MDCK (L), and NIH3T3 (M) cells. Scale bar, 20 µm. (N–Q) Fold change of protein synthesis rate quantified by the ratio of pulse-labeled OPP to SE protein stain (OPP/SE) (N), ribosome concentration quantified by the ratio of anti-RPS6 immunostain to SE protein stain (anti-RPS6/SE) (O), cell dry mass (SE) (P), and DNA replication (percentage of EdU labeled cells) (Q) in serum starved cells normalized to the median of control cells. Red dashed line indicates change fold = 1 (no change). (R,S) Fold change of protein densities and cytoplasmic lipid density in serum starved cells normalized to the median of control cells. Red dashed lines indicate change fold = 1 (no change). Black dots denote significant changes. The absolute changes in (N–S) are summarized in Supplementary Figures S13.

