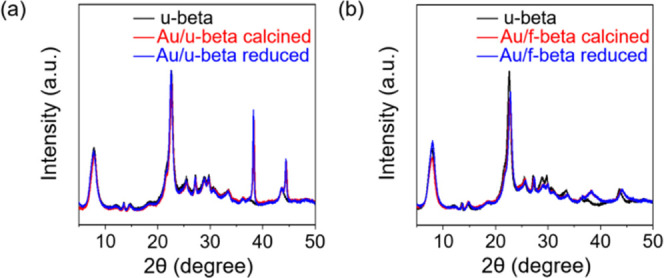
Figure 2.

XRD patterns of Au/u-beta (a) and Au/f-beta (b) samples taken after each successive step in the Au loading process: O2 calcination (at 350 °C for Au/u-beta, at 550 °C for Au/f-beta) and H2 reduction at 350 °C. In each case, the XRD pattern of u-beta is displayed in black for comparison.
