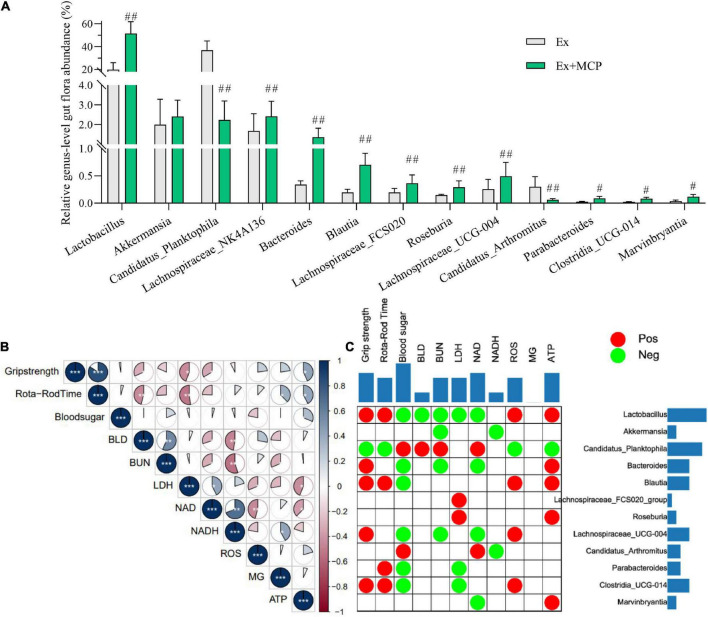
FIGURE 4.
Mice gut microbiota and their correlation to the fatigue-related biochemical parameters of exercising mice. (A) Relative genus-level gut flora abundance; (B) Pearson correlation analysis among fatigue-related indicators; (C) Pearson correlation analysis between fatigue-related indicators and relative genus-level gut flora abundance (red plots represent r ≥ 0.5, and green represent r ≤ −0.5; the two-side blue bar represents the number of positive/negative plots in each row or column, reflecting the importance of the gut microbiota (row) or biochemical parameter (column) in the correlation grid). #p < 0.05, ##p < 0.01 vs exercise (Ex) group.

