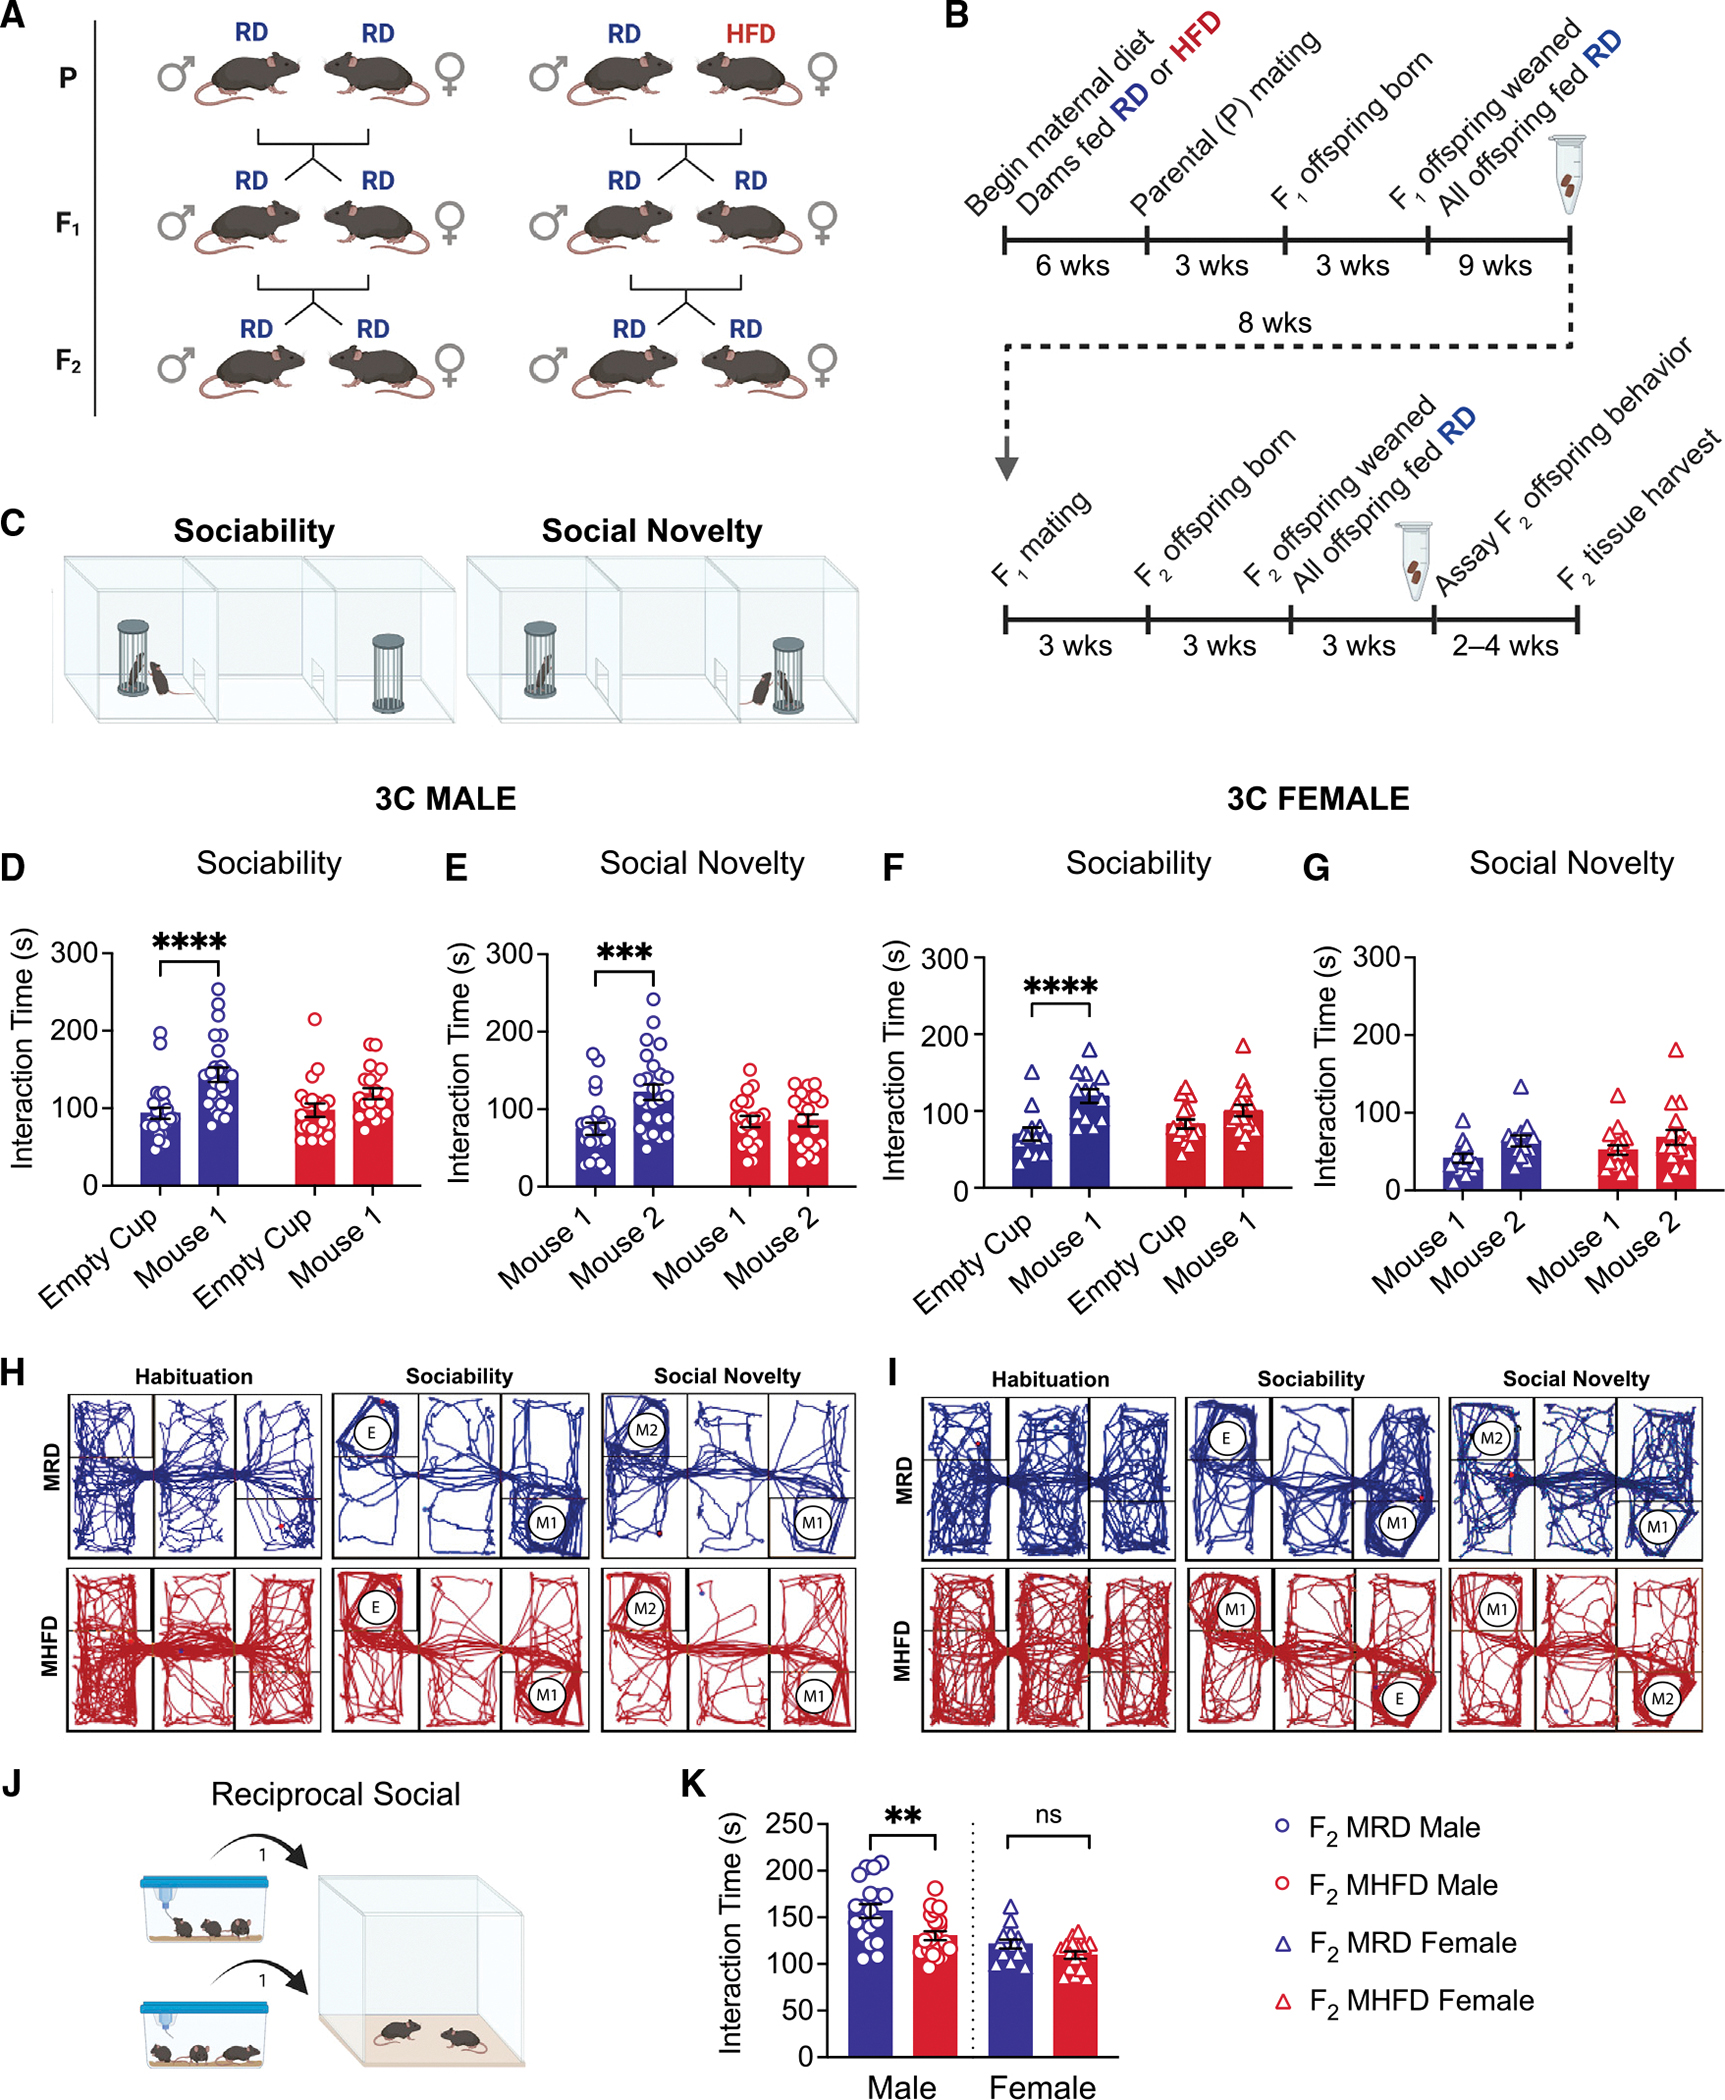
Figure 1. MHFD-descendant F2 offspring display social dysfunction.

(A) Schematic of breeding scheme to produce MRD- and MHFD-descendant F2 generations with HFD exposure indicated.
(B) Timeline of mating and behavior. Eppendorf tubes represent time of stool sample collection.
(C) Schematic of Crawley’s 3 chamber (3C) test for sociability and preference for social novelty.
(D and E) (D) MHFD F2 male offspring show impaired sociability (MRD: t(86) = 4.517, p < 0.0001; MHFD: t(86) = 1.735, p = 0.1651) and (E) preference for social novelty (MRD: t(43) = 4.208, p = 0.0003; MHFD: t(43) = 0.1159, p = 0.9916) compared with MRD F2 males.
(F) MRD F2 females show a strong preference in 3C sociability (MRD: t(28) = 5.406, p < 0.0001), with MHFD F2 female offspring showing mild deficits in sociability (MHFD: t(28) = 2.181, p = 0.0741).
(G–I) (G) Neither MRD nor MHFD F2 female offspring showed a statistically significant preference for social novelty (MRD: t(28) = 1.934, p = 0.1224; MHFD: t(28) = 1.613, p = 0.222). Representative MRD-descendant (blue) or MHFD-descendant (red) F2 offspring 3C track plots for (H) males and (I) females.
(J) Reciprocal social interaction schematic.
(K) Comparison of reciprocal social interaction times revealed decreased interaction among MHFD-descendant F2 male, but not female, stranger pairs (male MHFD versus MRD: t(39) = 3.103, p = 0.0036; female MHFD versus MRD: t(28) = 1.918, p = 0.0653). Bar graphs show mean ± SEM with individual data points representing biological replicates. (D–G) N = 13–25 subjects per group; (K) N = 14–22 pairs per group.
