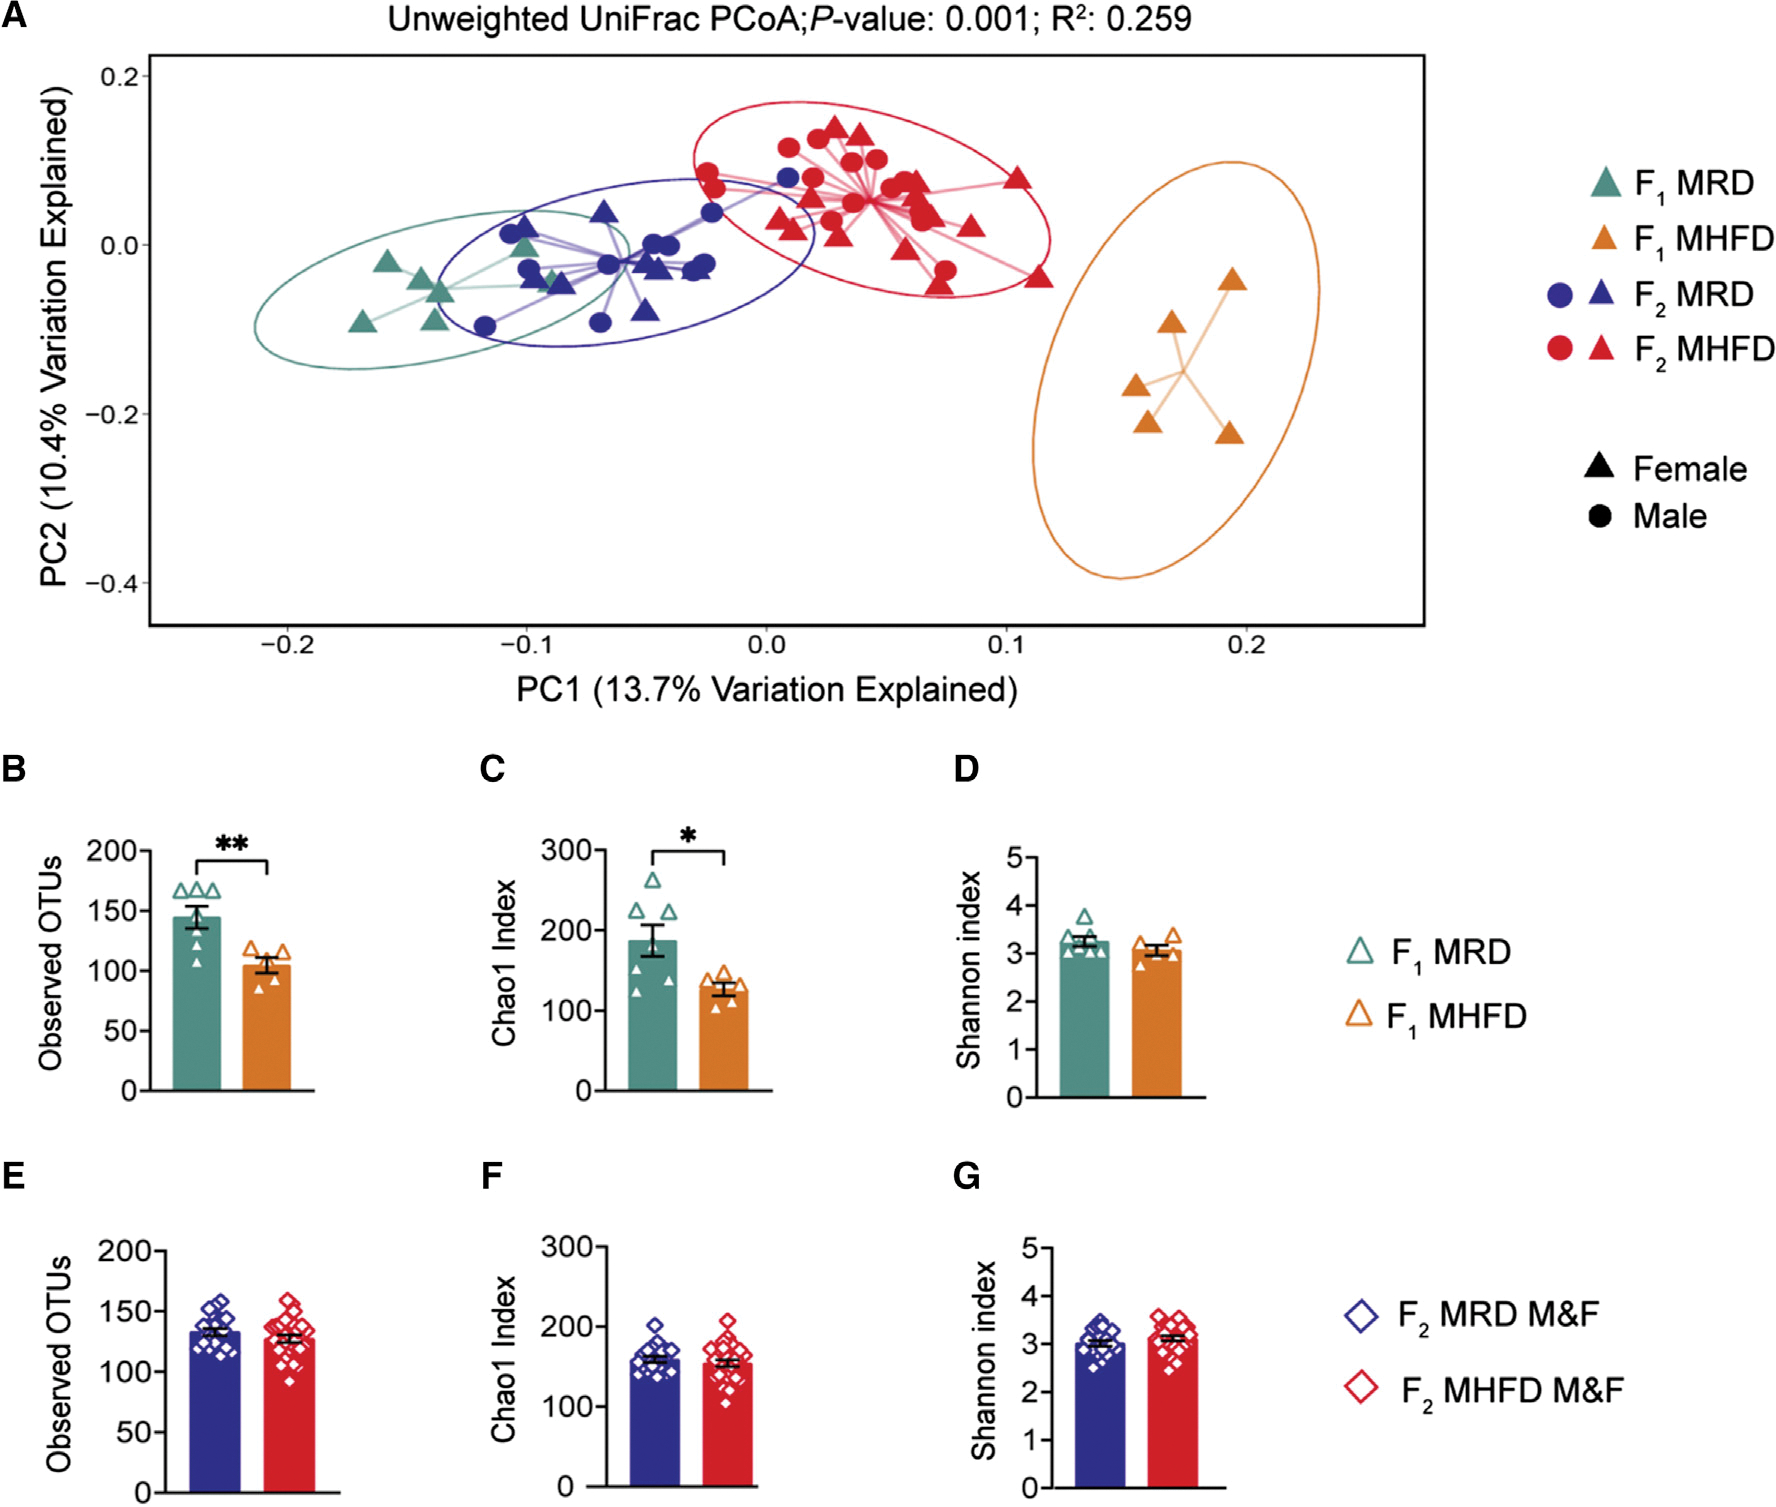
Figure 2. F2 MHFD descendants harbor a distinct gut microbiome from F2 MRD descendants but show a partial recovery of richness.

(A) Principal-coordinate analysis (PCoA) of unweighted UniFrac distances from the averaged rarefied 16S rRNA gene amplicon sequencing dataset (8,310 reads/sample; n = 1,000 rarefactions) revealed statistically significant clusters based on diet and generation (p = 0.001, R2 = 0.259).
(B–D) Alpha diversity metrics of F1 females used to generate F2 offspring revealed a statistically significant loss of microbial diversity in MHFD compared with MRD dams, as measured by observed OTUs (MHFD F1 versus MRD F1: t(10) = 3.272, p = 0.0084) and Chao1 index (MHFD F1 versus MRD F1: t(10) = 2.494, p = 0.0317). The Shannon diversity index did not differ between cohorts (MHFD F1 versus MRD F1: t(10) = 1.204, p = 0.2564).
(E–G) No significant differences in alpha diversity between F2 groups were observed, as measured by observed OTUs (MHFD F2 versus MRD F2: t(45) = 1.192, p = 0.2395), Chao1 index (MHFD F2 versus MRD F2: t(45) = 0.8097, p = 0.4224), and Shannon index (MHFD F2 versus MRD F2: t(45) = 1.274, p = 0.2093). Bar graphs show mean ± SEM with individual data points representing biological replicates. (A–G) N = 5–15 subjects per group.
