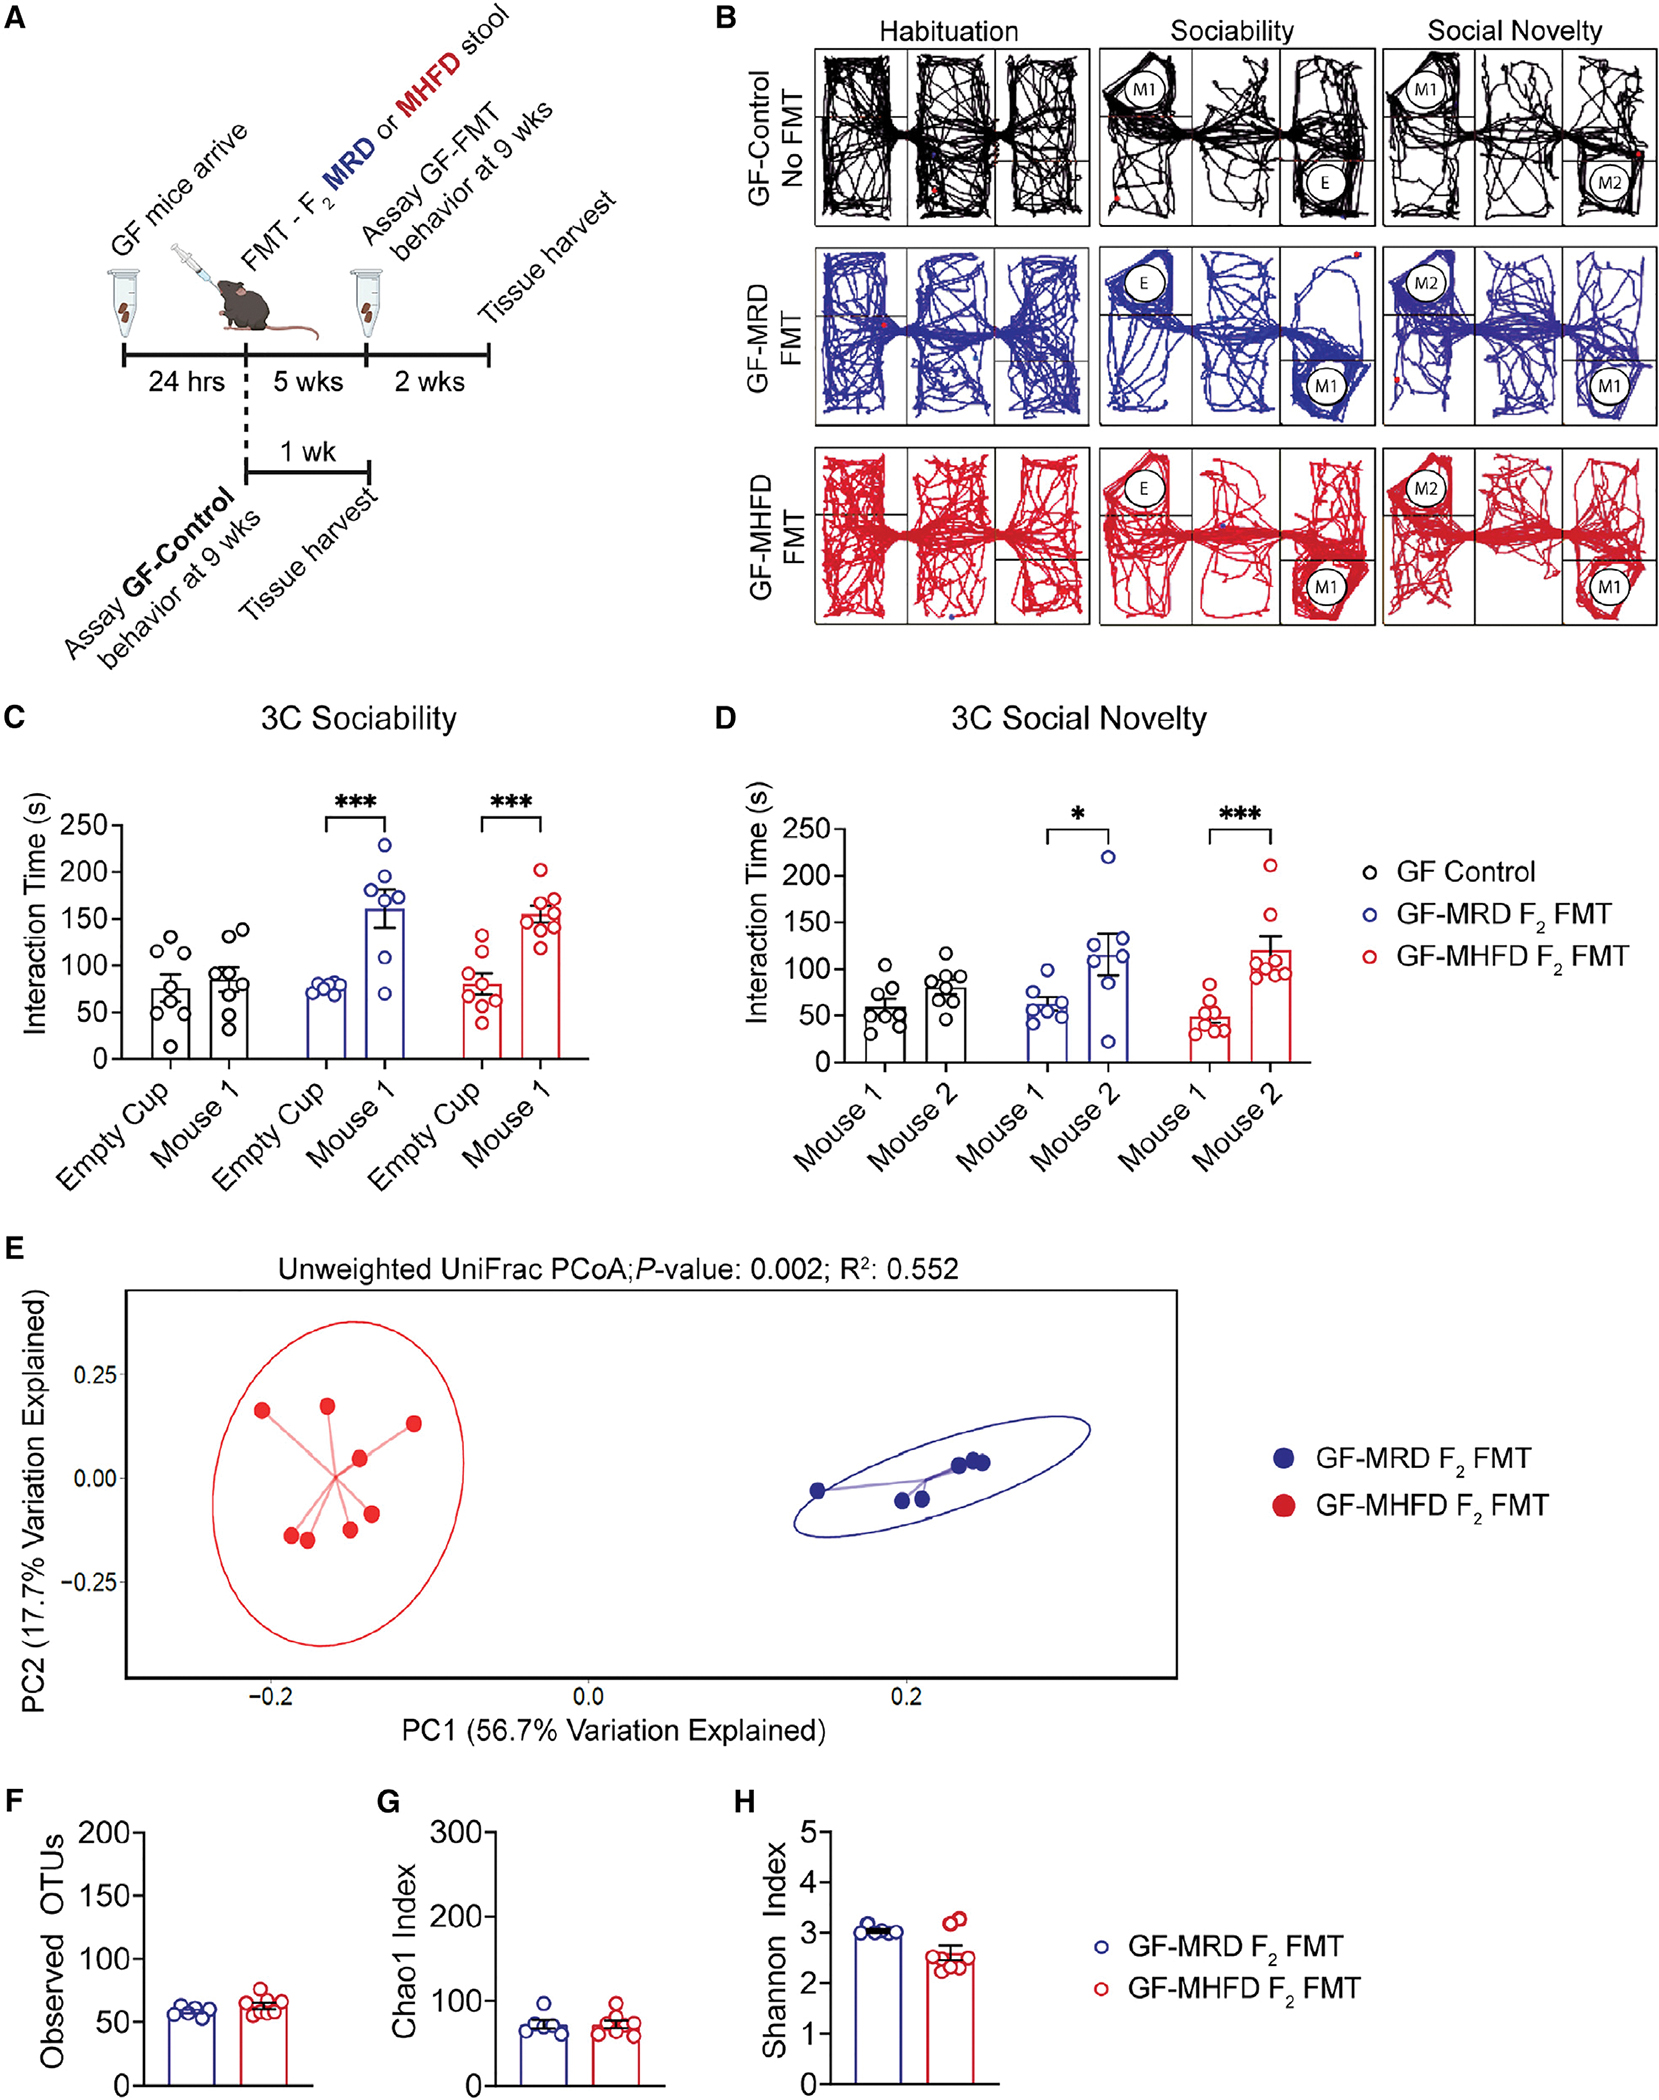
Figure 4. Fecal microbiota transplants from both F2 MRD and MHFD descendants rescue germ-free social deficits.

(A) Timeline of germ-free (GF) fecal microbiota transplant (FMT), stool collection for 16S rRNA gene sequencing, and behavioral analysis.
(B–D) (B) Representative 3C track plots for GF-Control (black), GF MRD-FMT (blue), or GF MHFD-FMT (red) males. 3C interaction times for (C) sociability (GF-Control: t(20) = 0.5364, p = 0.9349; MRD-FMT: t(20) = 4.688, p = 0.0004; MHFD-FMT: t(20) = 4.429, p = 0.0008) and (D) preference for social novelty (GF-Control: t(20) = 1.355, p = 0.4696; MRD-FMT: t(20) = 3.155, p = 0.0149; MHFD-FMT: t(20) = 4.558, p = 0.0006) showing social dysfunction in GF males is rescued by FMT from either MRD- or MHFD-descendant F2 donors. Bar graphs show mean ± SEM with individual data points.
(E) PCoA of unweighted UniFrac distances from the averaged rarefied 16S rRNA gene amplicon sequencing dataset (3,370 reads/sample; n = 1,000 rarefactions) revealed statistically significant clusters based on diet (p = 0.002, R2 = 0.552).
(F–H) Alpha diversity metrics did not differ between GF MRD-FMT or GF MHFD-FMT males, as measured by observed OTUs (GF MRD-FMT versus GF MHFD-FMT: t(12) = 1.391, p = 0.1895), Chao1 index (GF MRD-FMT versus GF MHFD-FMT: Mann-Whitney U = 22, p = 0.8518), and Shannon diversity index (GF MRD-FMT versus GF MHFD-FMT: Mann-Whitney U = 12, p = 0.1419). Bar graphs show mean ± SEM with individual data points representing biological replicates.
(C–H) N = 7–8 subjects per group.
