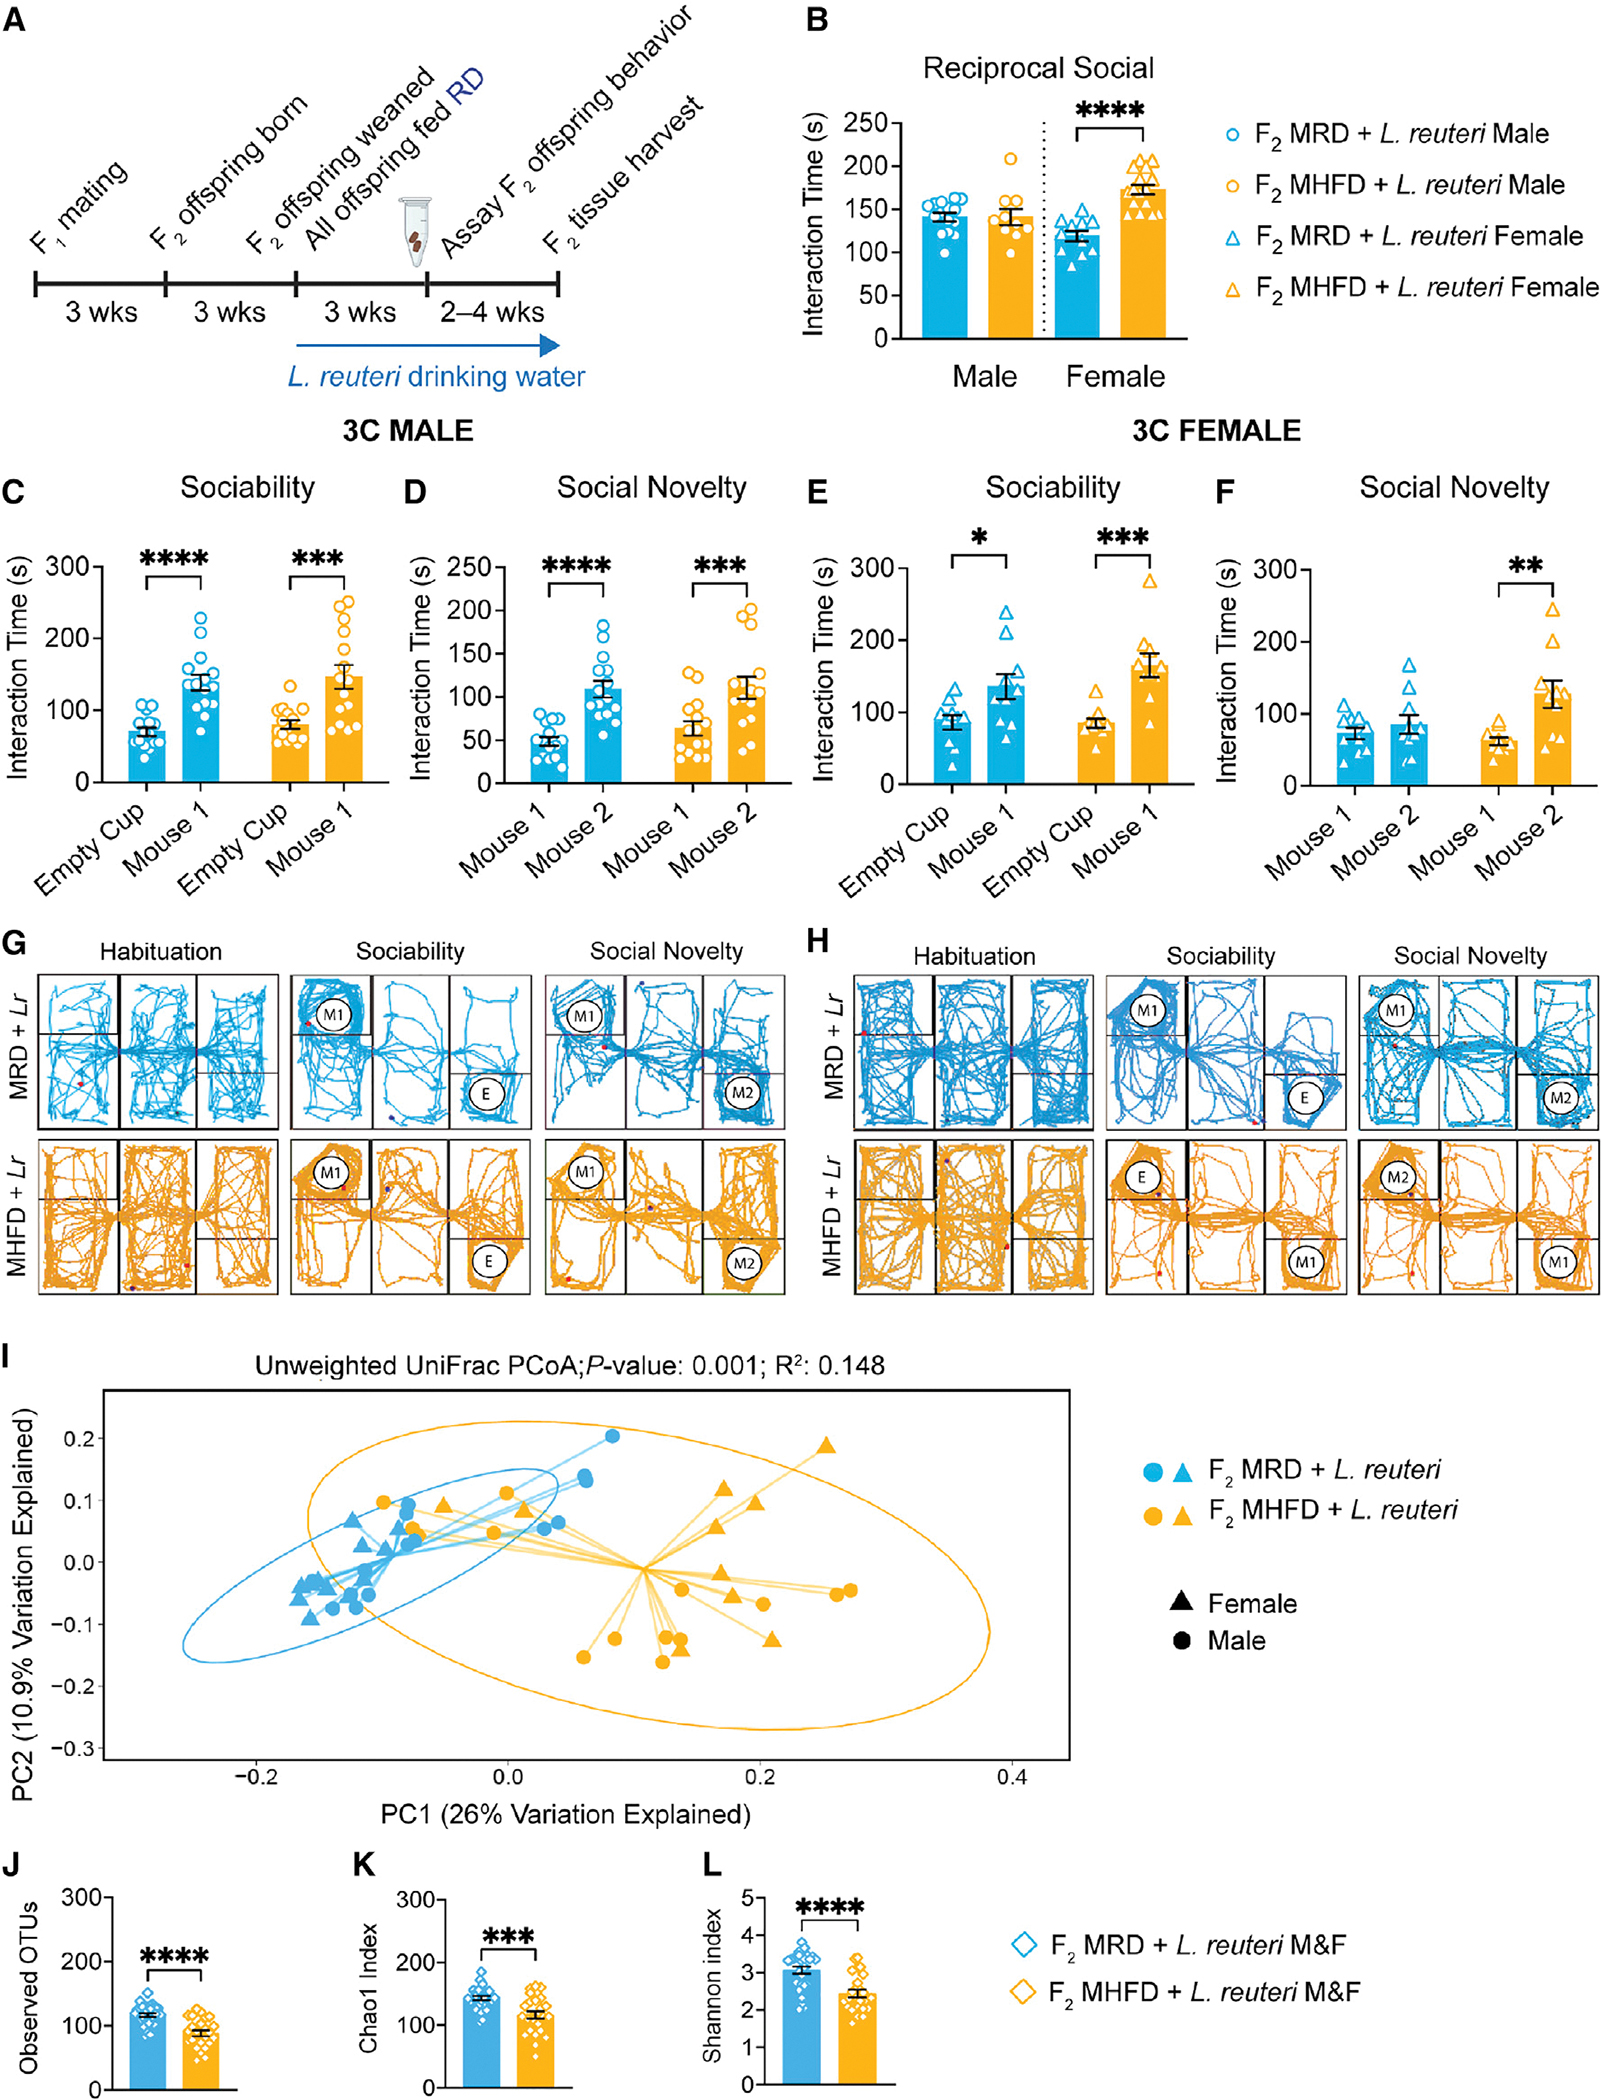
Figure 5. L. reuteri rescues social deficits in male F2 MHFD-descendant offspring and exerts differential effects on F2 MRD versus MHFD offspring gut microbiota composition.

(A) Experimental schematic. Three monogamous MRD lineage or MHFD lineage F1 breeder cages were used to establish MRD- and MHFD-descendant F2 generations, respectively. Upon weaning at 3 weeks old, all mice were given drinking water containing 108 CFU/mL L. reuteri daily through behavior assessment.
(B) Analysis of the reciprocal social interaction times between pairs revealed no differences between males (male MHFD + L reuteri versus MRD + L. reuteri: t(22) = 0.01855, p = 0.9854), with increased interaction times between F2 MHFD + L. reuteri females compared with F2 MRD + L. reuteri females (female MHFD + L. reuteri versus MRD + L. reuteri: t(25) = 6.340, p < 0.0001).
(C and D) (C) F2 male MHFD + L. reuteri offspring show typical preference during sociability (MRD: t(56) = 4.515, p < 0.0001; MHFD: t(56) = 4.373, p = 0.0001) and (D) social novelty (MRD: t(28) = 5.472, p < 0.0001; MHFD: t(28) = 4.28, p = 0.0004).
(E–H) (E) Likewise, MHFD + L. reuteri F2 female offspring show a statistically significant preference during sociability (MRD: t(36) = 2.633, p = 0.0246; MHFD: t(36) = 4.253, p = 0.0003) and (F) preference for social novelty (MRD: t(18) = 0.7226, p = 0.7228; MHFD: t(18) = 3.763, p = 0.0028). Representative MRD + L. reuteri (light blue) or MHFD + L. reuteri (light orange) track plots for (G) males and (H) females, respectively. Bar graphs show mean ± SEM with individual data points.
(I) PCoA of unweighted UniFrac distances from the averaged rarefied 16S rRNA gene amplicon sequencing dataset (5,508 reads/sample; n = 1,000 rarefactions) revealed statistically significant clusters based on diet (p = 0.001, R2 = 0.148).
(J–L) L. reuteri administration differentially affects MRD and MHFD F2 gut microbiome alpha diversity, as measured by observed OTUs (MHFD F2 + L. reuteri versus MRD F2 + L. reuteri: t(50) = 5.285, p < 0.0001), Chao1 index (MHFD F2 + L. reuteri versus MRD F2 + L. reuteri: t(52) = 4.143, p = 0.0001), and Shannon index (MHFD F2 + L. reuteri versus MRD F2 + L. reuteri: t(50) = 4.436, p < 0.0001). Bar graphs show mean ± SEM with individual data points representing biological replicates. B, N = 10–16 pairs per group; (C–F) N = 10–15 subjects per group; (I–L) N = 24–28 subjects per group.
