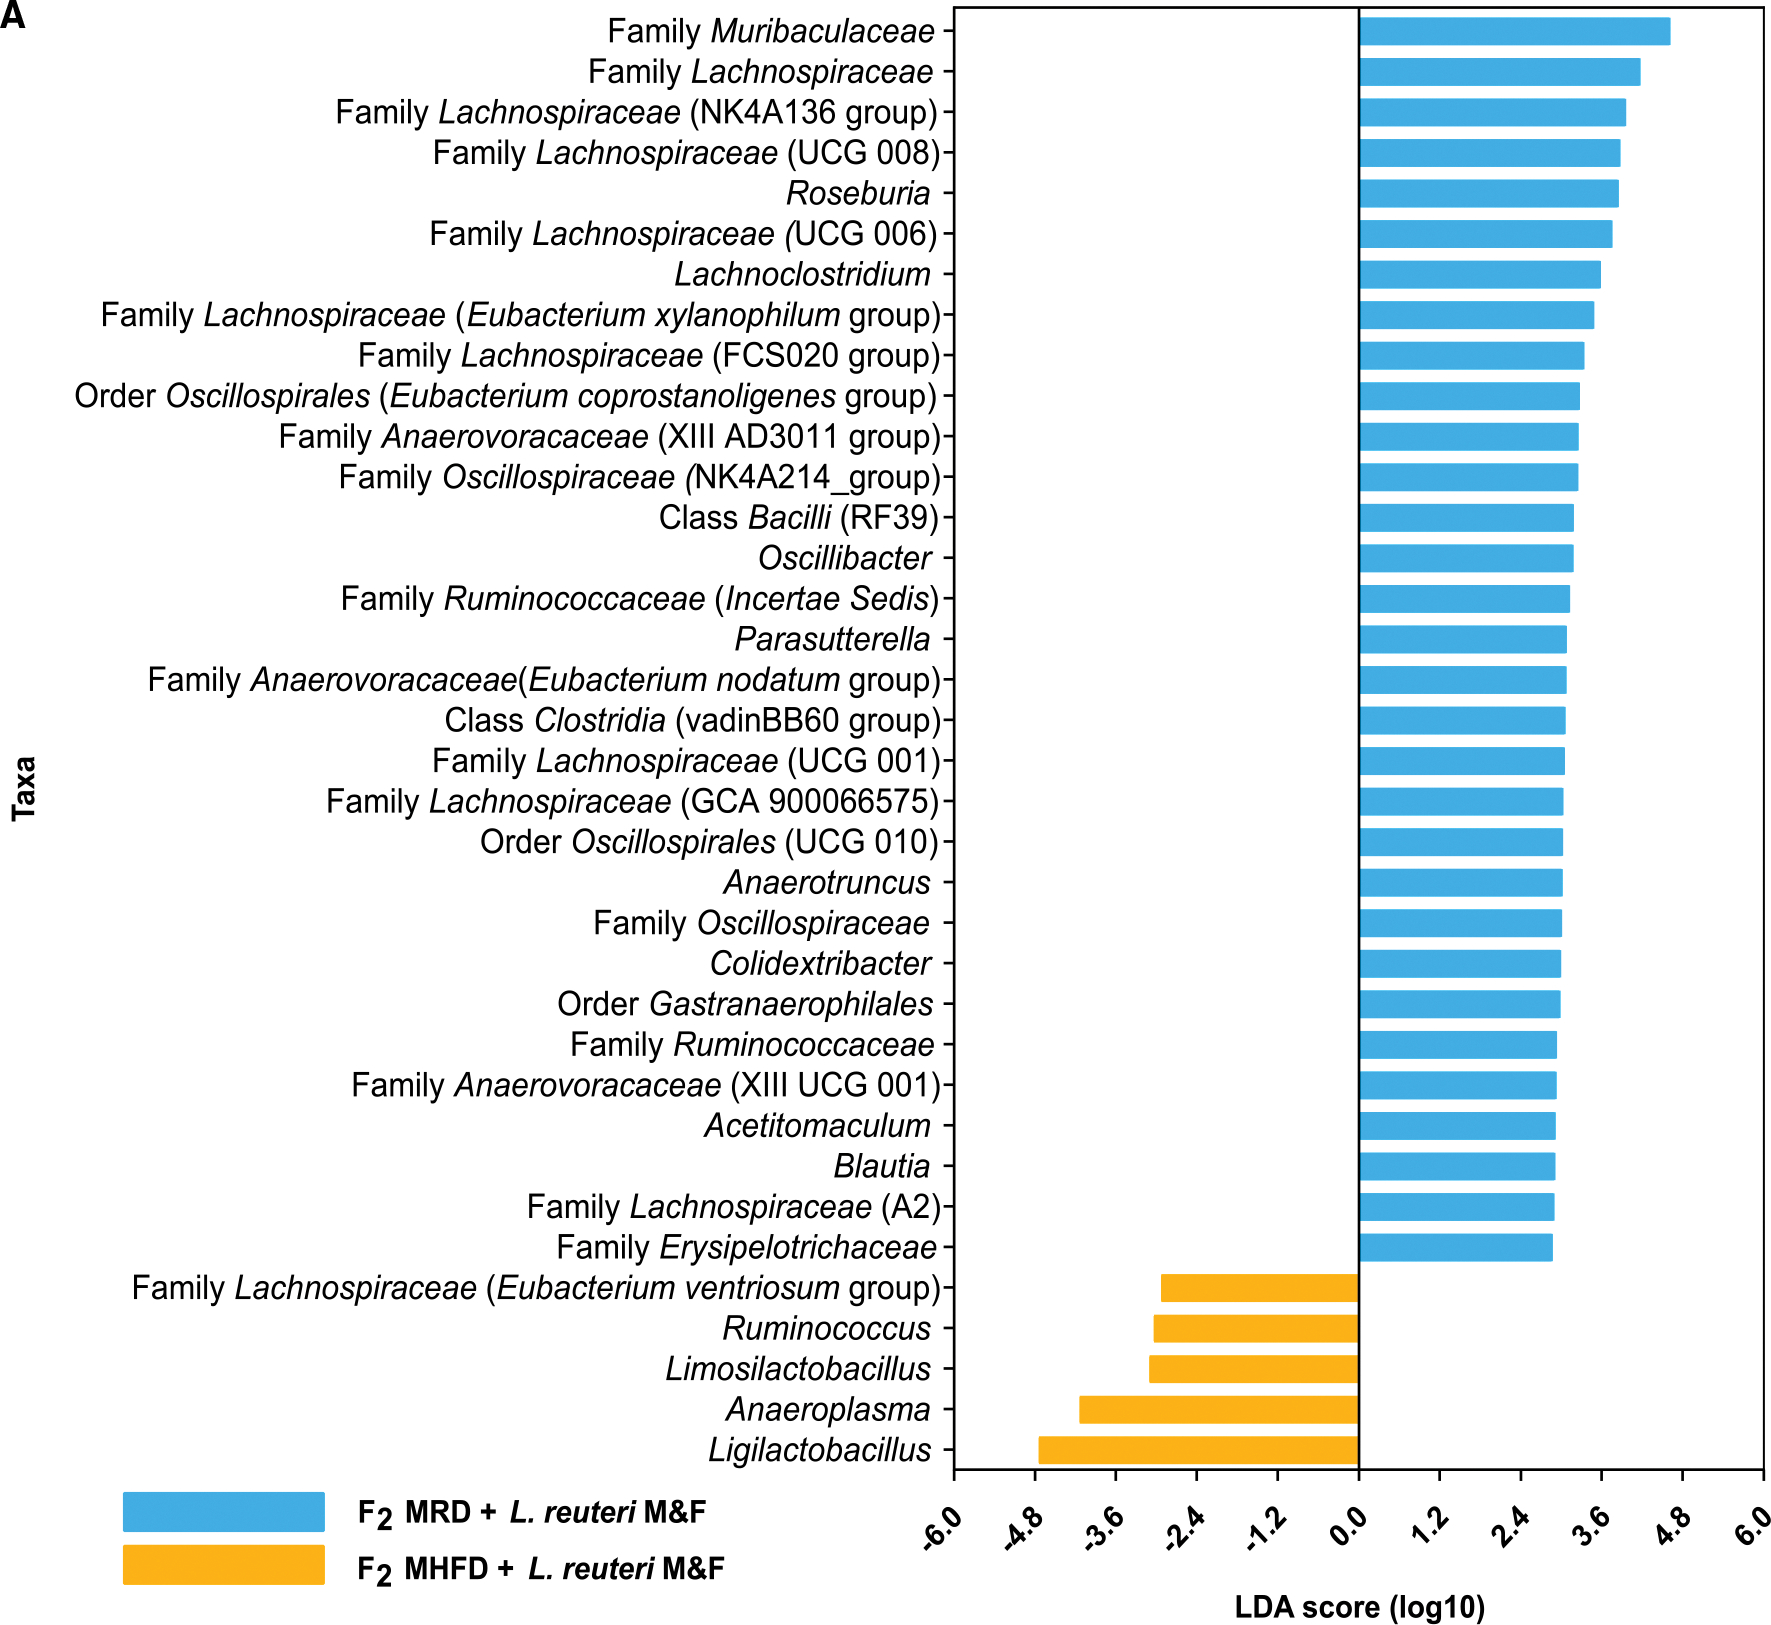
Figure 6. LEfSe analysis indicates differentially abundant genus-level taxa between diet lineage in L. reuteri-treated F2 groups.

Histogram of the LDA scores (log10) computed for genus-level taxa with differential abundance in MHFD and MRD F2 offspring treated with L. reuteri. LDA, linear discriminant analysis; LEfSe, LDA effect size. N = 24–28 subjects per group.
