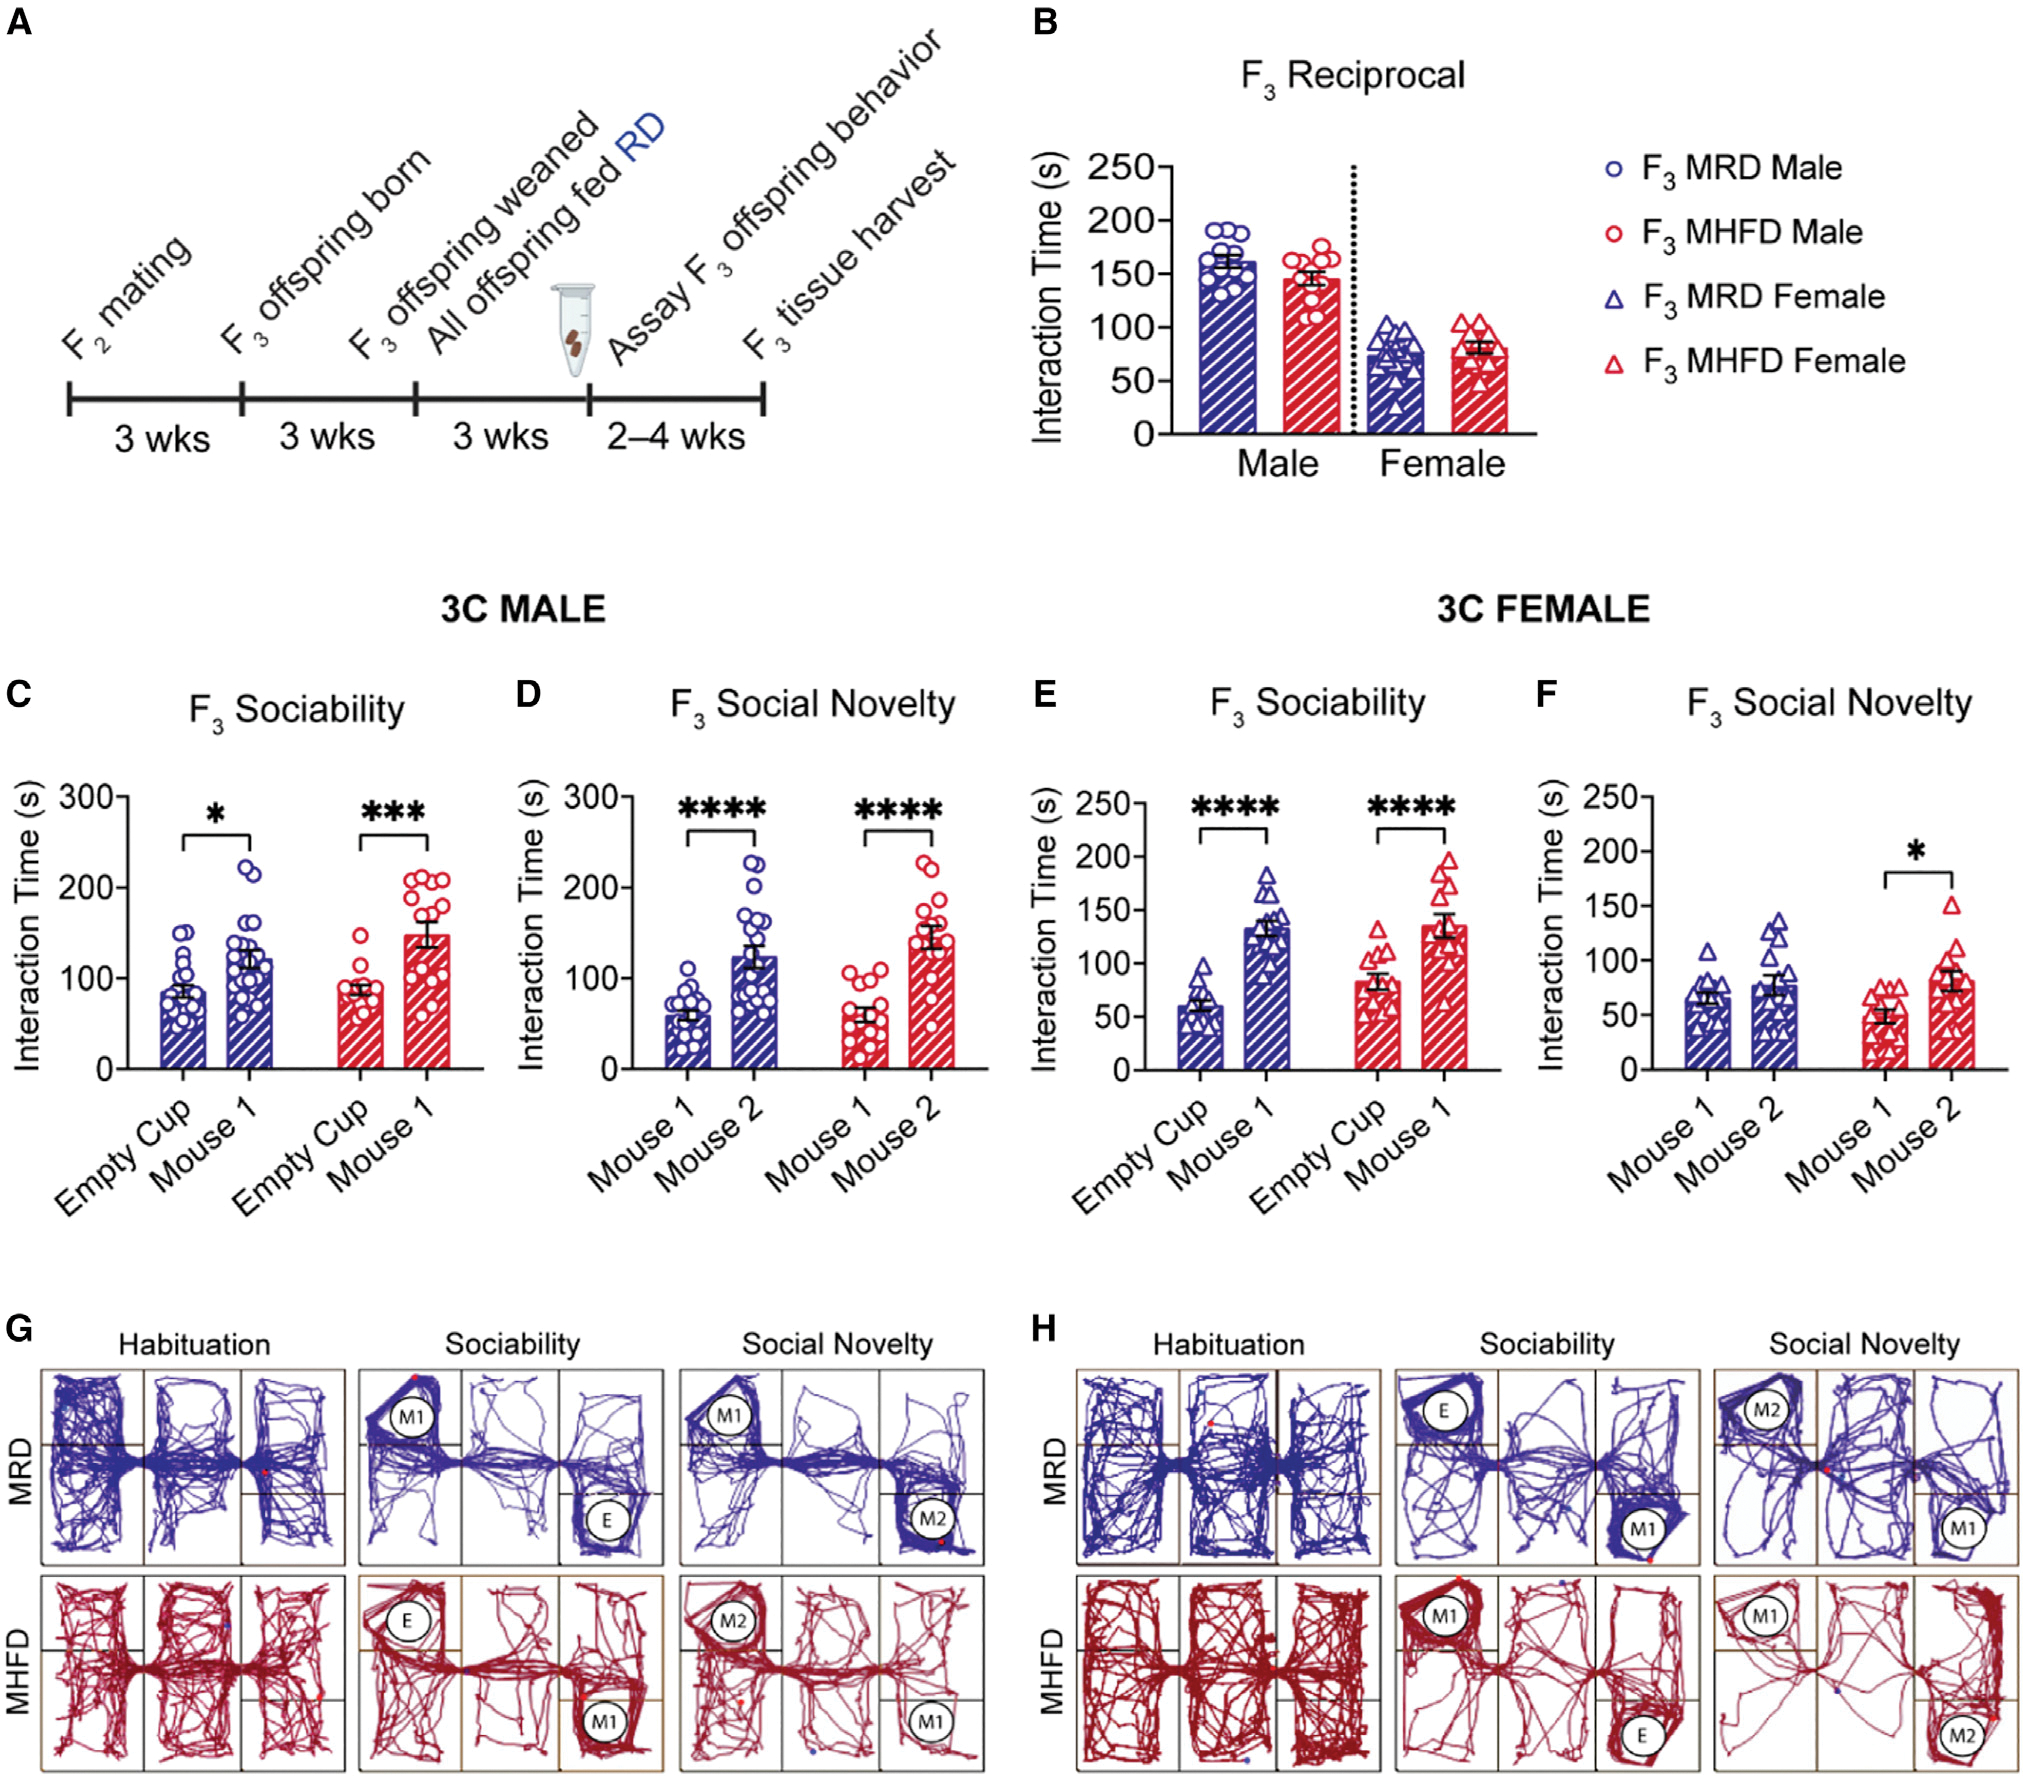
Figure 7. Neurotypical social behavior is observed in the MHFD-descendant F3 generation.

(A) Breeding schematic. MRD control and MHFD-descendant F2 mice were bred to produce the MRD- and MHFD-descendant F3 generations, respectively.
(B–H) (B) Comparison of reciprocal social interaction times revealed no differences between male (F3 MRD versus MHFD: t(22) = 1.824, p = 0.0817) or female pairs (F3 MRD versus MHFD: t(24) = 0.9925, p = 0.3309). Both MRD- and MHFD-descendant F3 males demonstrate normal sociability (C) (MRD: t(33) = 2.934, p = 0.0120; MHFD: t(33) = 4.322, p = 0.0003) and preference for social novelty (D) (MRD: t(33) = 5.493, p < 0.0001; MHFD: t(33) = 6.271, p < 0.0001) in the 3C task. F3 MRD and MHFD female offspring show a statistically significant preference for mouse 1 during the sociability phase of the 3C task (E) (MRD: t(48) = 6.979, p < 0.0001; MHFD: t(48) = 4.663, p < 0.0001), while only MHFD-descendant F3 females show a preference for social novelty (F) (MRD: t(48) = 1.722, p = 0.4632; MHFD: t(48) = 2.879, p = 0.0118). Representative MRD and MHFD track plots for (G) males and (H) females, respectively. Bar graphs show mean ± SEM with individual data points representing biological replicates. (B) N = 11–15 pairs per group; (C–F) N = 12–20 subjects per group.
