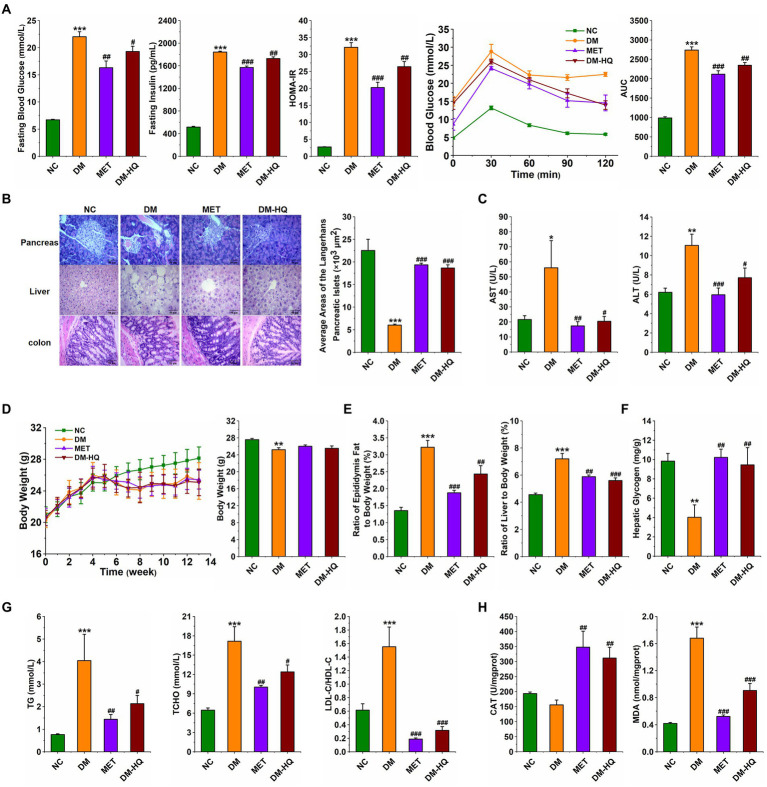
Figure 1.
Huang-Qi-Ling-Hua-San (HQLHS) attenuated HFD and STZ induced type 2 diabetes. (A) Fasting blood glucose, fasting insulin level, homeostasis model assessment-insulin resistance (HOMA-IR), oral glucose tolerance test (OGTT), and area under the curve (AUC). (B) Morphological observation of pancreas (magnification, ×200, 50 μm), liver (magnification, ×200, 50 μm), colon (magnification, ×400, 50 μm) with H&E staining, and the average area of the pancreatic islets of Langerhans. (C) Serum levels of aspartate aminotransferase (AST) and alanine aminotransferase (ALT). (D) The weekly weight change and the final weight at 13th week in the four groups. (E) Epididymal fat index and liver index. (F) Level of hepatic glycogen. (G) Blood triglycerides, cholesterol, LDL-C/HDL-C levels. (H) Serum levels of Catalase (CAT) and malondialdehyde (MDA). Data are expressed as mean ± SEM; One-way ANOVA was used to analyze statistical differences; Compare to NC: *p < 0.05; **p < 0.01; ***p < 0.001; Compare to DM: #p < 0.05; ##p < 0.01; ###p < 0.001.

