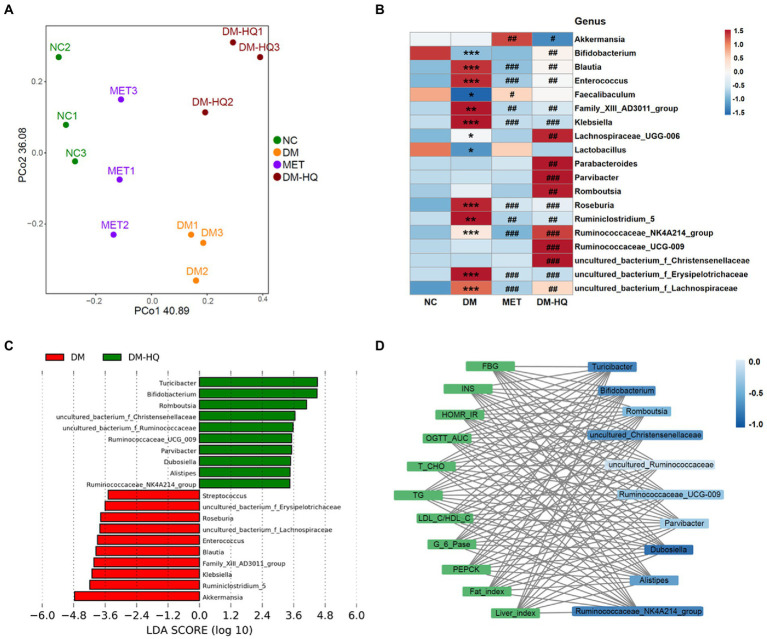
Figure 2.
HQLHS regulated the intestinal flora disorder caused by type 2 diabetes. (A) Principal co-ordinates analysis (PCoA) of the cecal content microbiota. (B) Heat map statistics of significant difference genus. (C) Analysis of differences in the microbial taxa shown by [linear discriminant analysis (LDA; LEfSe) coupled with effect size measurements] between the DM group and the DM-HQ group (log10 LDA > 2.0). (D) Visualization of the correlation network between glycolipid parameters and dominant genus in the DM-HQ group based on Spearman’s rank correlation coefficient. Data are expressed as mean ± SEM. One-way ANOVA was used to analyze statistical differences; Compare to NC: *p < 0.05; **p < 0.01; and ***p < 0.001; Compare to DM: #p < 0.05; ##p < 0.01; and ###p < 0.001.

