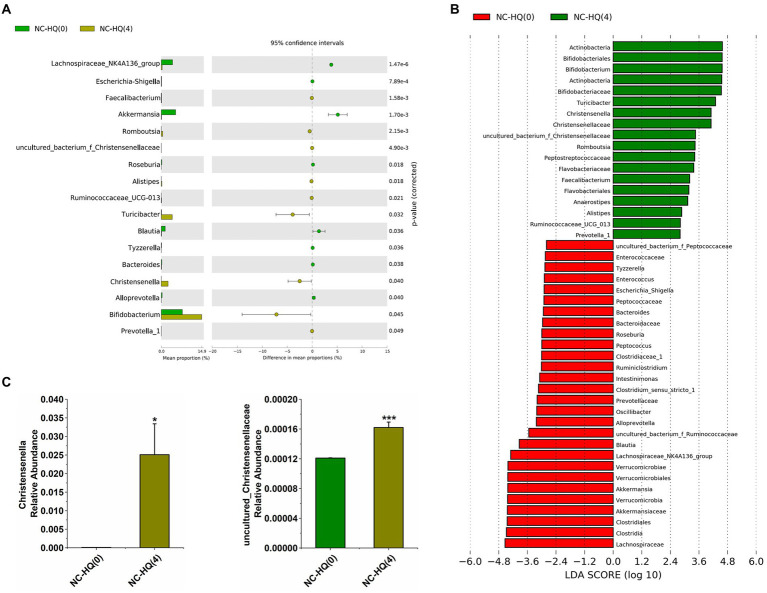
Figure 3.
(A) Differential abundant features of genus before and after HQLHS treatment. (B) Discriminative taxa determined by LEfSe between the two groups (log10 LDA > 2.0). (C) Comparison proportion of Christensenella and uncultured_bacterium_f_Christensenellaceae in feces before and after HQLHS treatment. Statistical analysis was performed using Student’s t-test between NC-HQ(0) and NC-HQ (Saeedia et al., 2019) groups. Data are expressed as mean ± SEM. Compare to NC-HQ(0): *p < 0.05; ***p < 0.001.

