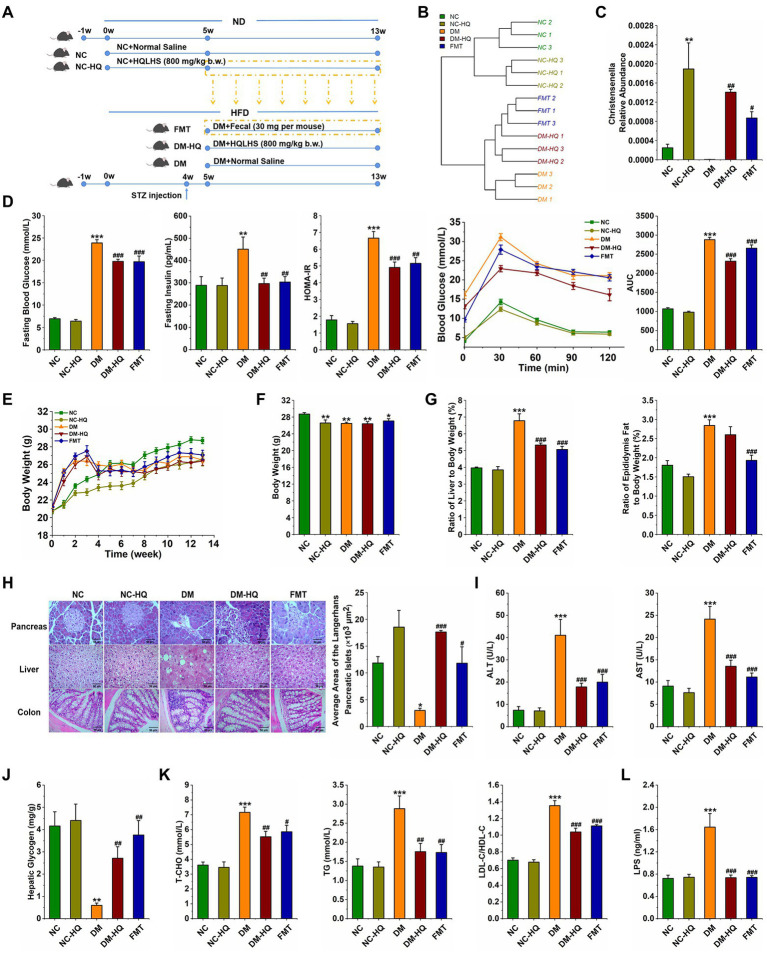
Figure 4.
Treatment with fecal microbiota alleviated HFD and STZ induced type 2 diabetes. (A) Experimental design. (B) Hierarchical clustering tree of the cecum microbiota. (C) Relative abundance of Christensenella of five groups at week 13. (D) Fasting blood glucose, serum level of fasting insulin, HOMA-IR, OGTT test, and area under the curve (AUC). (E) The weekly weight changes. (F) Body weight at week 13. (G) The ratio of epididymis to body weight and the ratio of liver to body weight, respectively. (H) Morphological observation of pancreas (magnification, ×200, 50 μm), liver (magnification, ×200, 50 μm), colon (magnification, ×400, 50 μm) with H&E staining, and the average area of the pancreatic islets of Langerhans. (I) Serum ALT and AST levels. (J) Liver glycogen level. (K) Serum triglycerides, the total cholesterol, LDL-C/HDL-C levels. (L) Serum LPS level. Data are expressed as mean ± SEM; One-way ANOVA was used to analyze statistical differences; Compare to NC: *p < 0.05; **p < 0.01; and ***p < 0.001; Compare to DM: #p < 0.05; ##p < 0.01; and ###p < 0.001.

