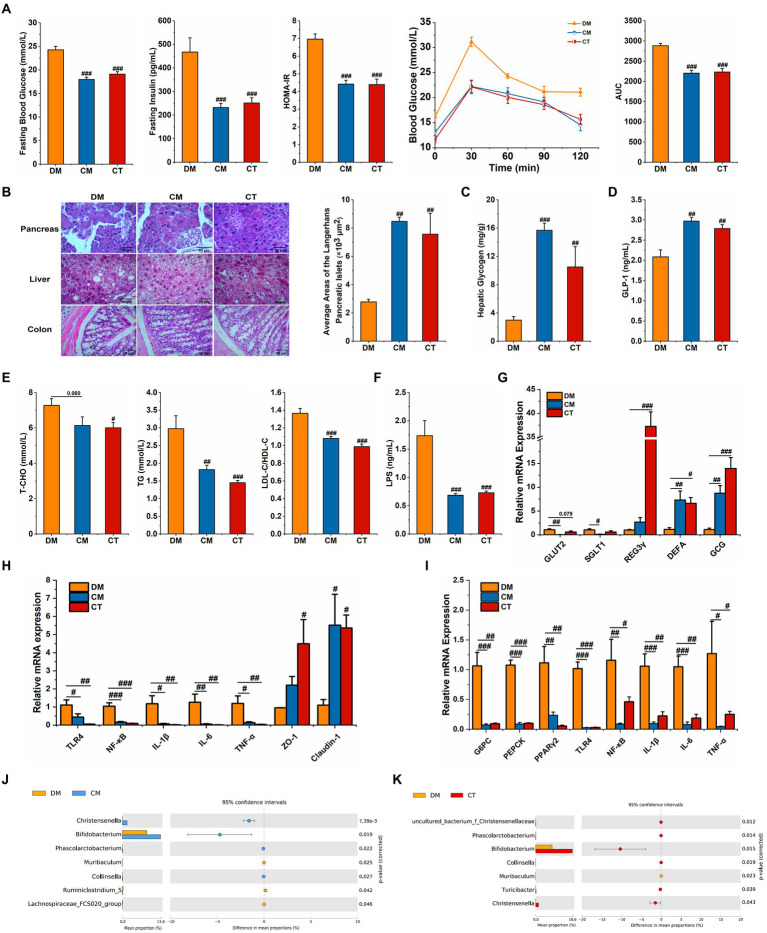
Figure 5.
Supplementation with Christensenella ameliorated HFD and STZ induced type 2 diabetes. (A) Fasting blood glucose, serum level of insulin, homeostasis model assessment-insulin resistance (HOMA-IR), OGTT test, and area under the curve (AUC). (B) Morphological observation of pancreas (magnification, ×200, 50 μm), liver (magnification, ×200, 50 μm), colon (magnification, ×400, 50 μm) with H&E staining, and average areas of the pancreatic islets of Langerhans. (C) Liver glycogen level. (D) Serum GLP-1 level. (E) Serum triglycerides, cholesterol, LDL-C/HDL-C levels. (F) Serum LPS level. (G) Relative mRNA expression of GLUT2, SGLT1, and GCG in ileum tissue. (H) Relative mRNA expression of TLR4, NF-κB, IL-1β, IL-6, TNF-α, ZO-1, and Claudin-1 in colon tissue. (I) Relative mRNA expression of G-6-Pase, PEPCK, TNF-a, TLR4, NF-κB, IL-1β, and IL-6 in the liver tissue. (J) Differential abundant feature of genus between the DM and the CM group. (K) Differential abundant feature of genus between the DM and the CT group. Data are expressed as mean ± SEM; Significant differences between the two groups were analyzed using Student’s t-test; One-way ANOVA was used to analyze statistical differences; Compare to DM: #p < 0.05; ##p < 0.01; ###p < 0.001.

