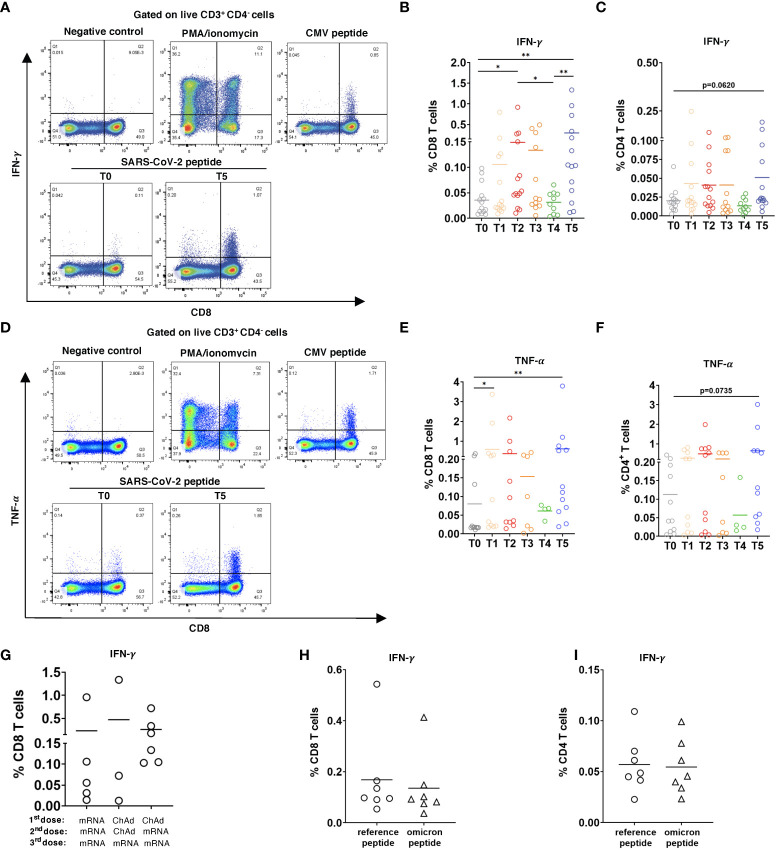
Figure 4.
CD8 and CD4 T cell responses to SARS-CoV-2 peptides. PBMC (2x10⁶) were stimulated with SARS-CoV-2 S overlapping peptide pool and anti-CD28 mAb for 6h. The treatment with PMA/ionomycin or CMV peptide pool were used as positive controls, whereas the incubation in medium containing 2% sterile water instead of peptides was considered as negative control. (A) Representative dot plots for IFN-γ. production by CD8 T cells at T0 and T5. Negative and positive controls are shown at T5. (B) Data are presented as the percentage of IFN-γ+ CD8 T cells among total CD8 T cells, (C) as well as IFN-γ+CD4+ T cells among total CD4 T cells with the subtraction of positively stained cells in the negative control (n=14). (D) Representative dot plots for TNF-α production by CD8 T cells at T0 and T5. (D-F) Results are shown as the percentage of TNF-α+ CD8+ T cells among total CD8 T cells (n= 11, [(E)] and TNF-α+CD4+ T cells [n=7, (F)] among total CD4 T cells. (G) Data on IFN-γ producing CD8 T cells in participants vaccinated two times with mRNA (mRNA/mRNA, n=5), two times with ChAd (ChAd/ChAd, n=3) or with ChAd/mRNA (n=6) are presented as the frequency of IFN-γ+CD8+ T cells among total CD8 T cells. (H, I) PBMC were stimulated with Omicron peptide pool and reference peptide pool for 6h in the presence of anti-CD28 mAb. Frequency of IFN-γ+CD8+ T cells among total CD8 T cells [n=7, (H)] and IFN-γ+CD4+ T cells among total CD4 T cells [n=7, (i)] are shown. *P < 0.05, **P < 0.01.

