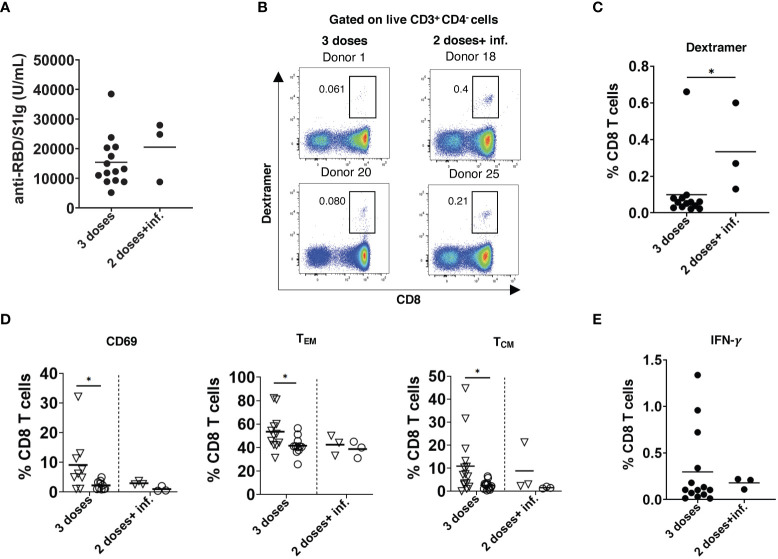
Figure 5.
Effect of breakthrough SARS-CoV-2 infection on antibody and T cell responses in vaccinated participants. (A) Total RBD/S1 Ig were measured in the serum of participants infected after 2 doses of vaccination (2 doses + inf.; n=3) or after 3rd dose (n=14) and expressed as U/mL. (B) Representative dot plots for SARS-CoV-2 spike specific CD8 T cells (dextramer+CD8+) from both groups. (C) Spike-specific CD8+ T cells infected after 2 doses of vaccination (n=3) or after 3rd dose (n=14) are shown as the percentage of dextramer+CD8+ T cells within total CD8 T cells. (D) Frequency of spike-specific CD69+, TEM, and TCM CD8 T cells after infection (n=3) and 3rd dose of vaccination (n=14) are presented as the percentage within total CD8 T cells. Dextramer+CD8+ and dextramer-CD8+ are indicated as inverted triangles and circles, respectively. (E) PBMC were stimulated with SARS-CoV-2 S peptide pool and anti-CD28 mAb for 6h. Data are presented as the percentage of IFN-γ+CD8+ T cells among total CD8 T cells (n=3 and 14 respectively). *P < 0.05.

