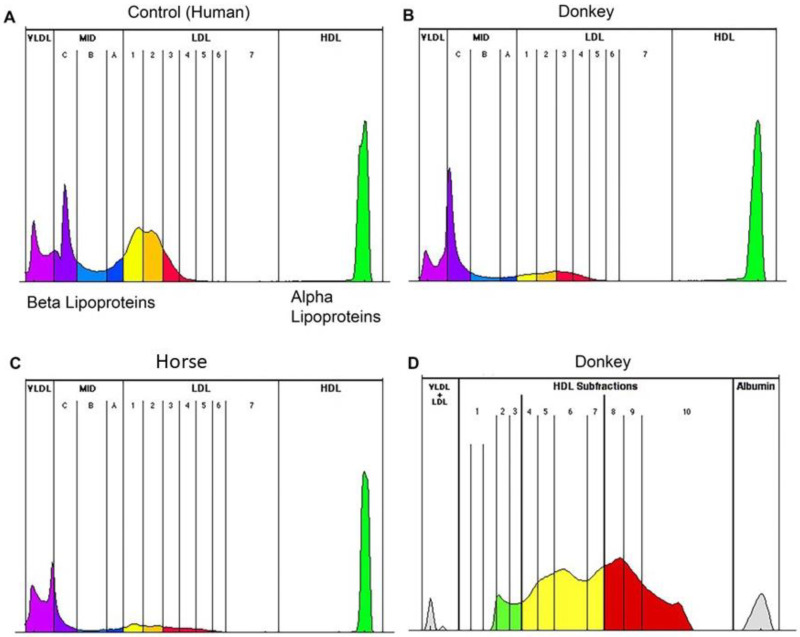
Figure 1.
Representative lipoprotein plots from (A) human plasma control sample, (B) donkey, horse, (C) showing peaks for VLDL (light purple), midfractions (dark purple and light blue), LDL (yellow, orange, and red), and HDL (green), (D) depicting a representative HDL subfractionation from a donkey sample. HDL are divided into large particles (green), intermediated sized particles (yellow) and small sized HDL (red). Numbers indicate the subfraction.

