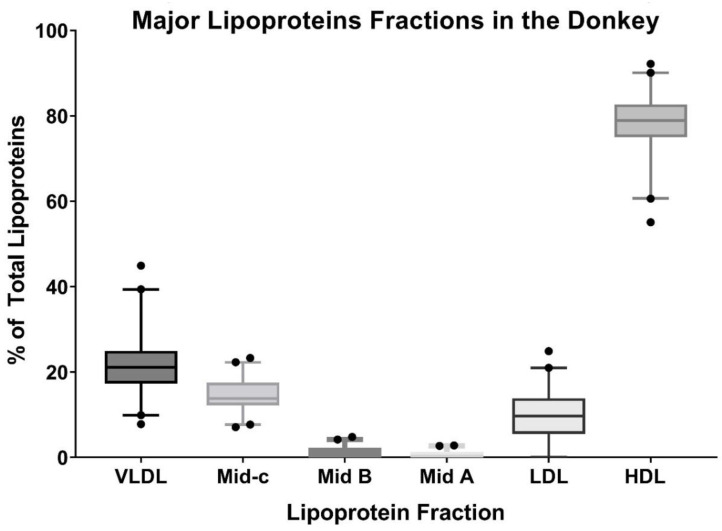
Figure 2.
Summative data of the Lipoprint® fractionation for all donkeys, displaying the median (bar) third and first quartiles (box), and 2.5–97.5% (whiskers) outliers are shown as individual points. The percent of total lipoproteins is generated from the area under the curves from the densitometry plots.

