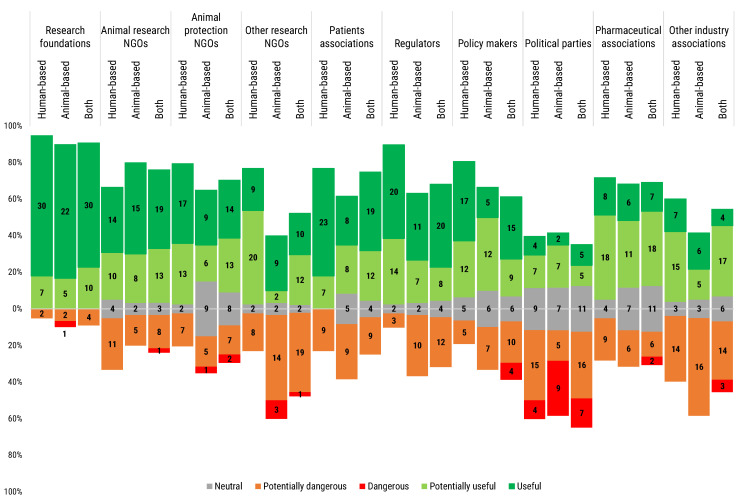
Figure 11.
Participants answered the following question “What is your opinion on the participation of the following organisations in the scientific and political debates regarding the orientation of research?”. The stacked chart, calibrated around the neutral answers, shows the number of respondents based on their opinion, from “Dangerous” (in red) to “Useful” (in dark green), and segmented by researchers’ use of animal- or human-based or both models. Histogram dimensions are represented as 100%, where 100% is the total number of participants of each subgroup: human-based (39), animal-based (30) and both (44) model users.

