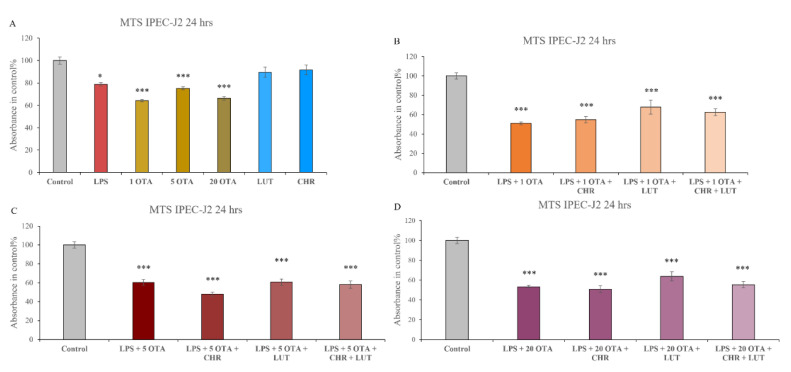
Figure 3.
Cell viability determination. Changes in IPEC-J2 cell viabilities were detected after 24 h of administration of 10 µg/mL LPS, 1 µM OTA, 5 µM OTA, 20 µM OTA and in their combinations in the absence and in the presence of 1 µM CHR and 8.7 µM LUT (A–D). Data are shown as means of absorbances expressed in control % with standard errors of mean (SEM); n = 3–4 samples per group; * indicates p < 0.05, *** indicates p < 0.001 compared to controls.

