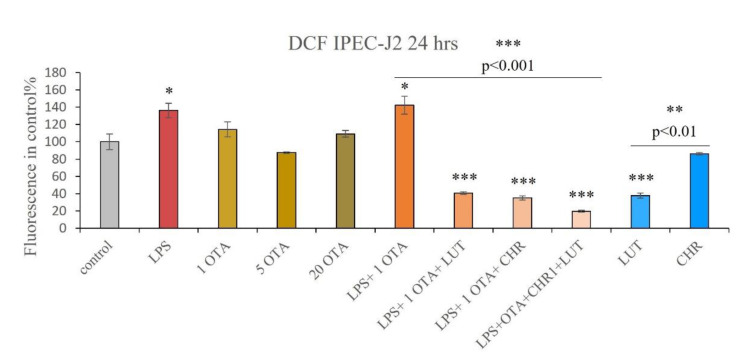
Figure 5.
Relative fluorescence intensity in control% using DCFH-DA method. Measurement of IC ROS levels after 24 h treatment of IPEC-J2 cells with 1 µM OTA, 5 µM OTA, 20 µM OTA, 1 µM CHR, 8.7 µM LUT, 10 µg/mL LPS and their combinations; data are shown as means of relative fluorescence intensities with SEM; n = 3 samples per group, * indicates p < 0.05, ** indicates p < 0.01, *** indicates p < 0.001; λexc = 480 nm, λem = 530 nm. Asterisks alone indicate significant differences between control and treated groups, asterisks with p values underlined show significant changes between the designated groups.

