Figure 1.

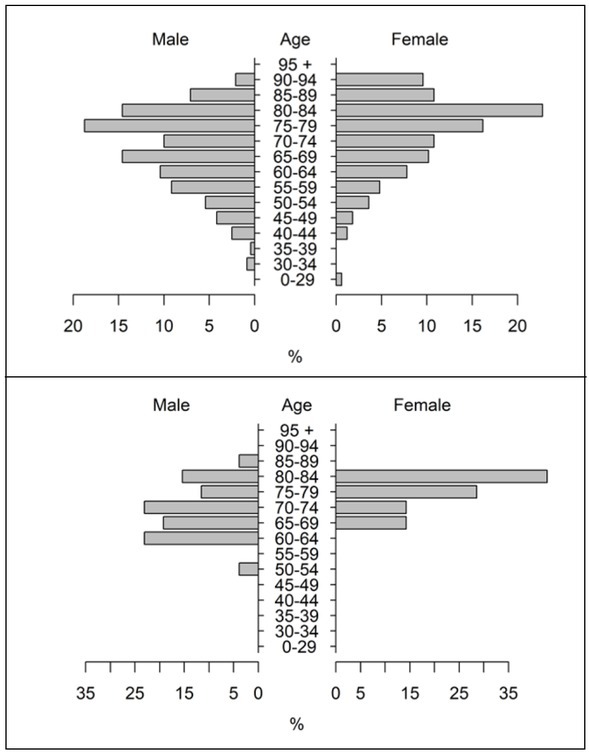
Age distribution of the hospitalized COVID-19 patients with respect to sex. Left: all patients (n=407); right: patients in intensive care at any time point (n=33).

Age distribution of the hospitalized COVID-19 patients with respect to sex. Left: all patients (n=407); right: patients in intensive care at any time point (n=33).