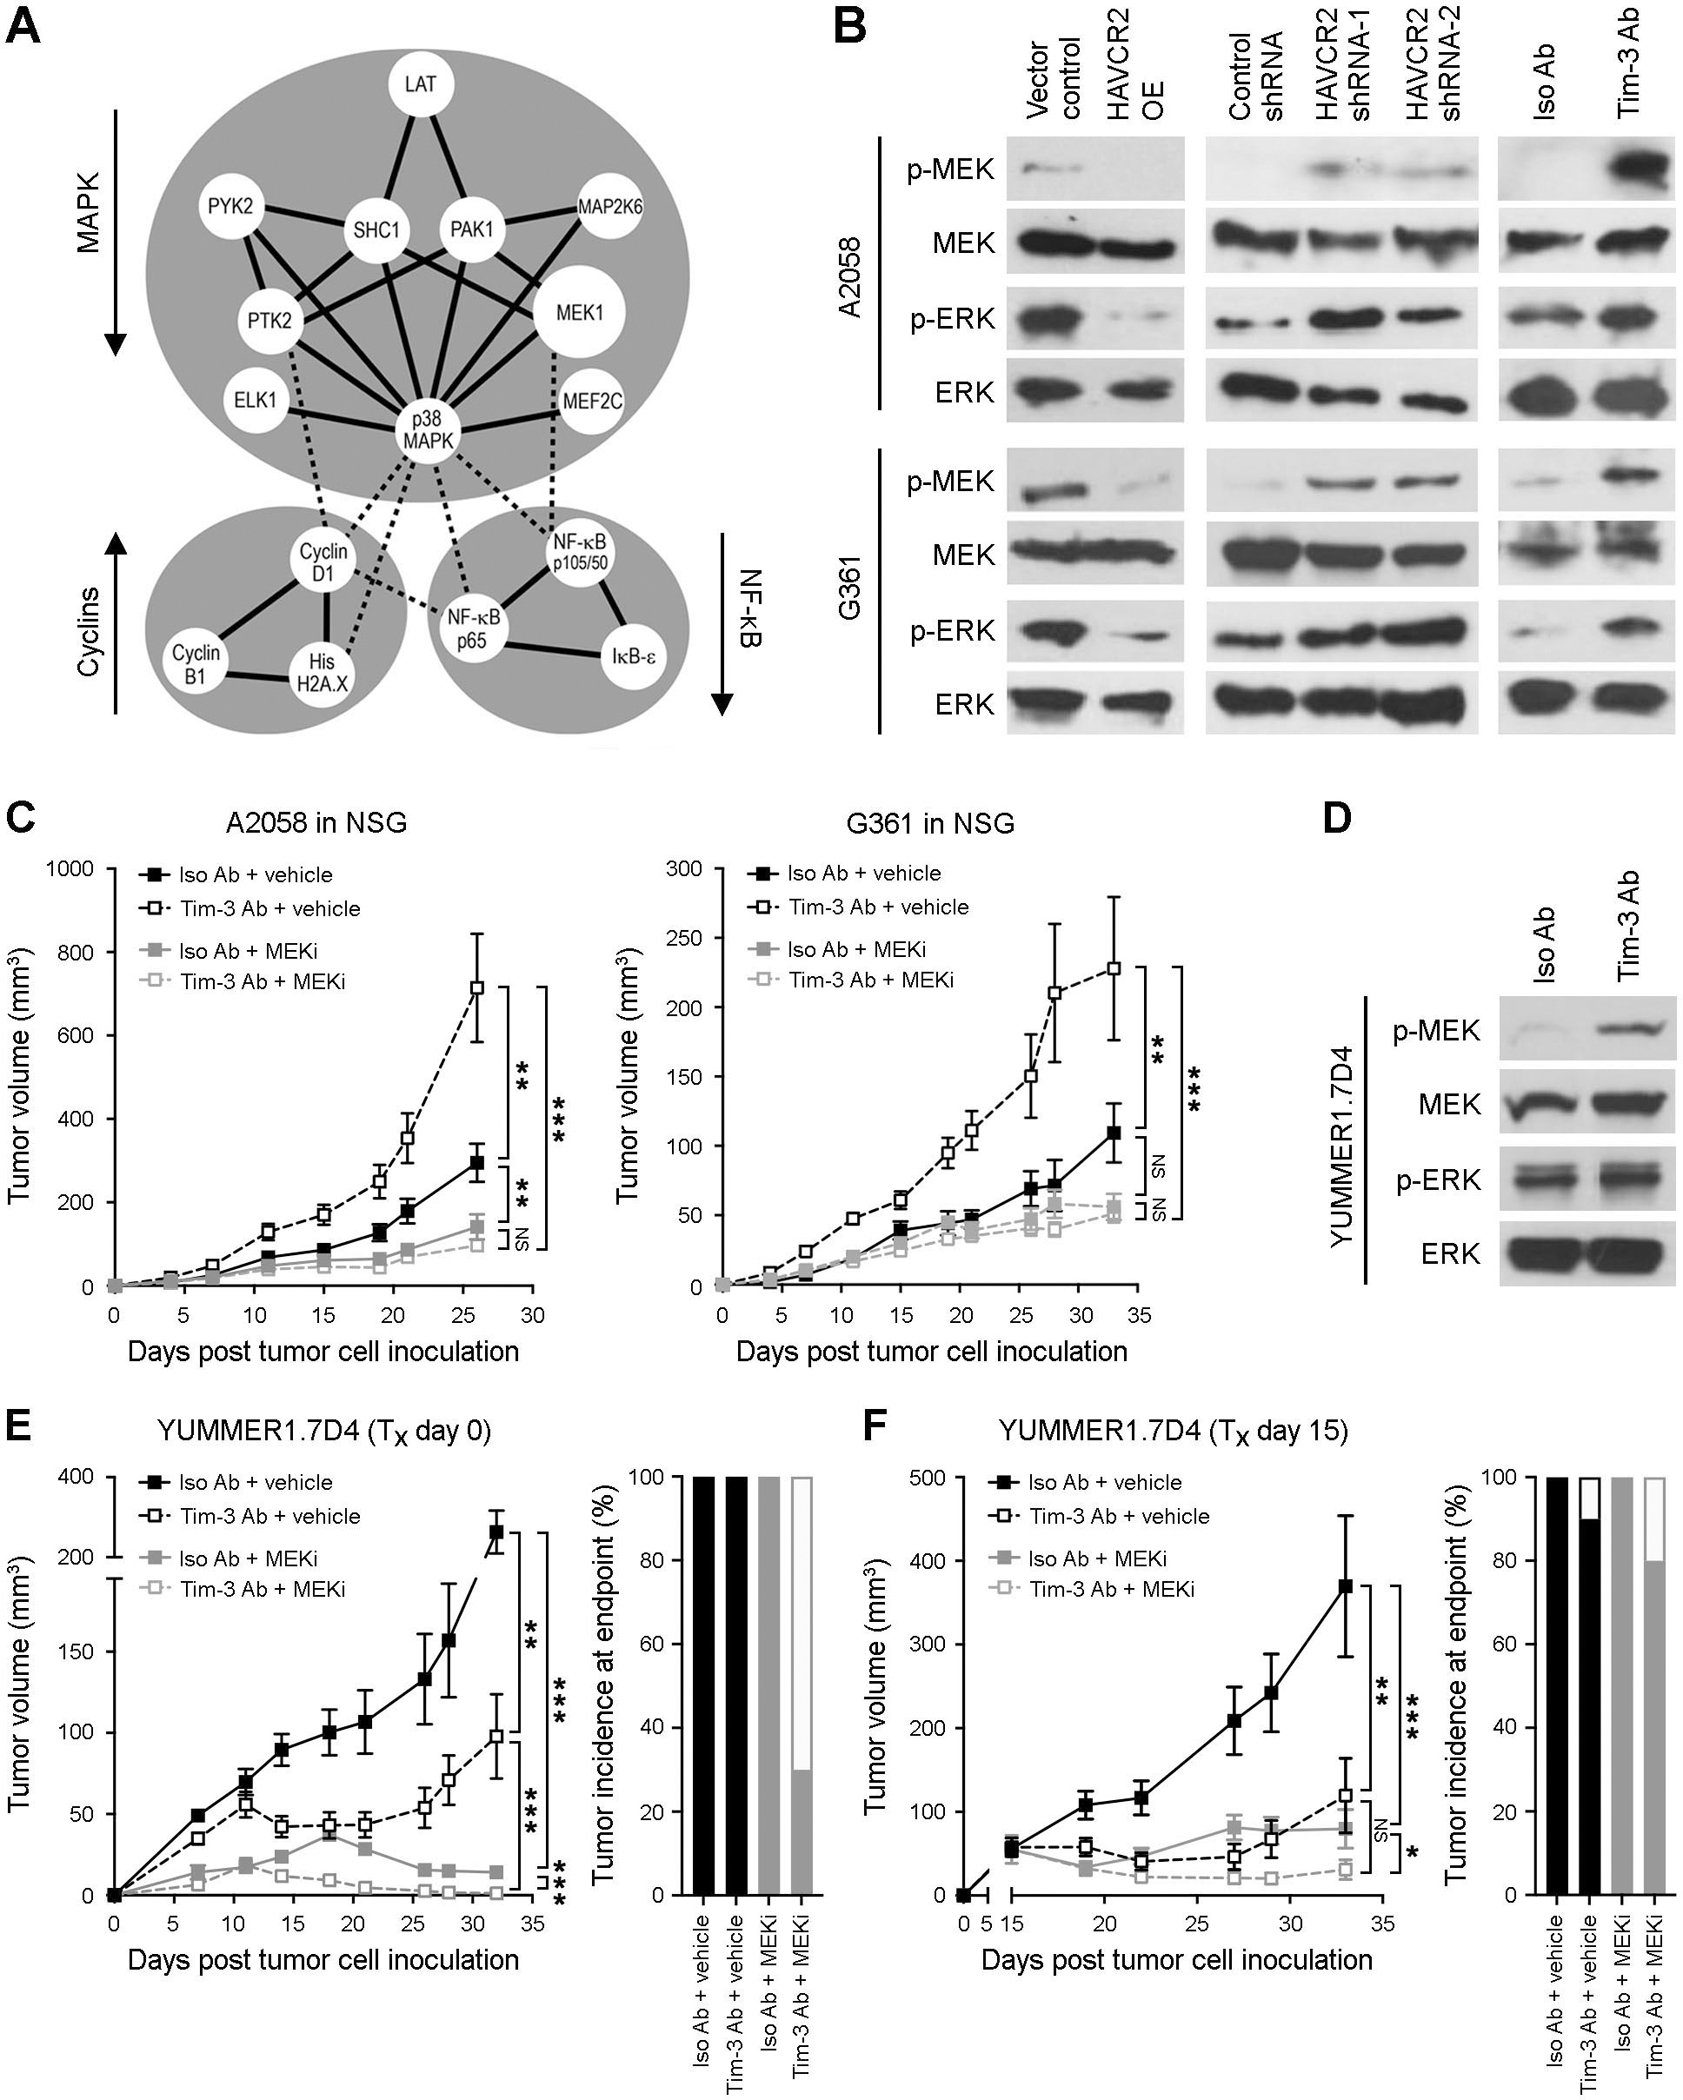
Figure 6. MEK inhibition reverses melanoma-Tim-3 blockade-mediated growth stimulation.

A, Protein-protein interaction map (STRING) of differentially phosphorylated proteins (Phospho Explorer Antibody Array) in Tim-3 (HAVCR2/Havcr2)-overexpressing (OE) versus vector control human A2058 and G361 or murine B16-F10 melanoma cells. Arrows indicate pathway activation (up) or inhibition (down); solid lines, strong protein-protein interactions; dashed lines, weaker protein–protein interactions. B, Immunoblots of phosphorylated (p) and total MEK1/2 and ERK1/2 in vector control versus HAVCR2 OE (left), control shRNA versus HAVCR2 knockdown (shRNA-1/-2, middle), and Tim-3 blocking versus isotype control Ab-treated (right) human A2058 (top) and G361 (bottom) cells. C, Tumor growth kinetics (mean ± SEM) of human A2058 (left) and G361 (right) cells in NSG mice treated with human-specific Tim-3 blocking versus isotype control mAbs, with or without submaximal dosage (0.15 mg/kg/d, p.o.) of the MEK inhibitor, trametinib. D, Immunoblots of p- and total MEK1/2 and ERK1/2 in anti-Tim-3 versus isotype control Ab-treated murine YUMMER1.7D4 melanoma cells. E-F, Tumor growth kinetics (left, mean ± SEM) and tumor incidence at experimental endpoint (right) of murine YUMMER1.7D4 cells in C57BL/6 mice treated (Tx) with anti-murine Tim-3 blocking versus isotype control mAbs, with or without trametinib (as in C) starting on E, day 0 or F, day 15 (n = 10 mice per treatment group, respectively). * p < 0.05; **, p < 0.01; ***, p < 0.001; NS, not significant. See also Figure S11.
