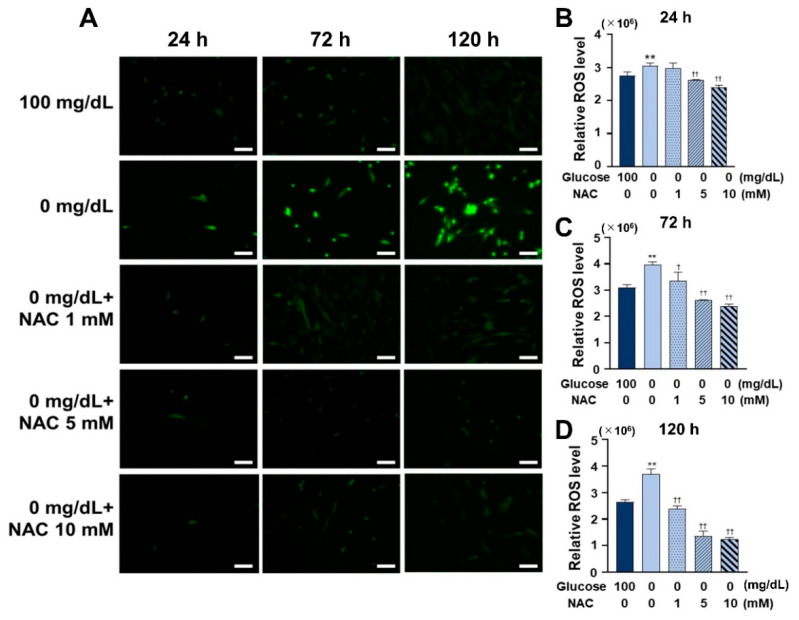
Figure 4.
Effect of NAC on ROS formation and anti-ROS ability under low glucose conditions. (A) The total ROS of the HGnFs was stained and photographed under a fluorescence microscope after adding 1, 5, and 10 mM NAC and incubating for 24, 72, and 120 h. (B–D) Total ROS levels after 24, 72, and 120 h of incubation with 1, 5, and 10 mM of NAC were measured using a fluorescent microplate reader, and the results were modified relative to 100 mg/dL (control group). (Scale bars: 100 μm; a significant increase compared with the control was described as ** p < 0.01; a significant decrease compared with the 0 mg/dL was described as † p < 0.05, †† p < 0.01).

