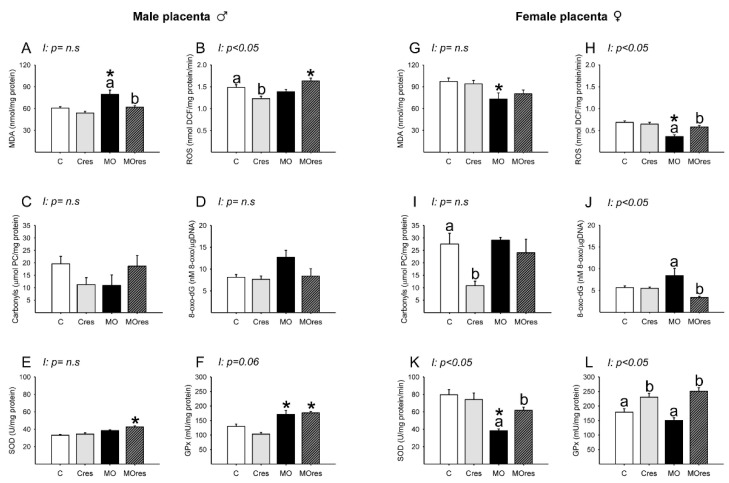
Figure 6.
Oxidative stress biomarkers and antioxidant enzyme activity in the male and female placenta at 19dG. Male and female: (A,G) MDA concentration (nmol/mg protein); (B,H) ROS concentration (nmol DCF/mg protein/min); (C,I) Carbonyls concentration (μmol PC/mg protein); (D,J) 8-oxo-dG concentration (8-oxo-dG nM/DNA (μg/μL)); (E,K) SOD activity (U/mg protein); (F,L) GPx activity (mU/mg protein). Values are mean ± SEM, (C: control, n = 8; Cres: control + resveratrol, n = 10; MO: maternal obesity, n = 7; MOres: maternal obesity + resveratrol, n = 7). Within the same group (C vs. Cres and MO vs. MOres), means labeled with different letters differ, p < 0.05; * different in comparison to the respective control (MO vs. C and MOres vs. Cres), p < 0.05. I = interaction between maternal diet and maternal resveratrol supplementation, n.s. = not significant.

