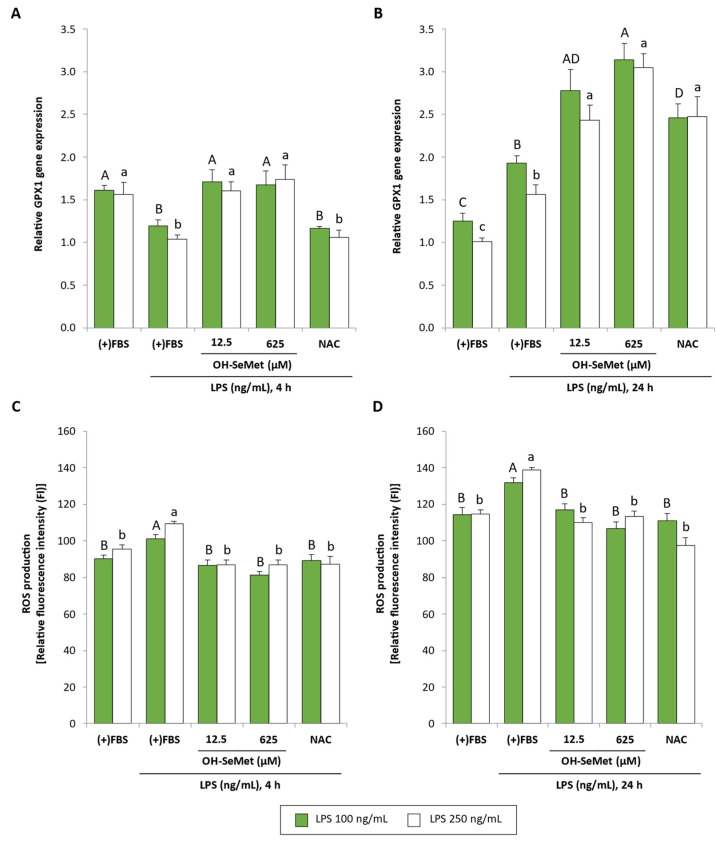
Figure 6.
GPX1 relative gene expression and ROS production in macrophages maintained in (+)FBS for 24 h, supplemented for 24 h with 12.5 and 625 μM OH-SeMet or 10 mM NAC and then stimulated with LPS (100 and 250 ng/mL) for 4 or 24 h (A–D, respectively). Gene expression results were calculated using 2−ΔCt. ROS production is shown as relative fluorescence intensity (FI) obtained at the beginning of the experiment ((FIf × 100)/FIi). The results are expressed as mean ± SEM of n = 6–9 cultures. The asterisk (*) denotes significant differences (p < 0.05) between the two LPS concentrations used for each incubation period. Different letters denote significant differences (p < 0.05) between conditions for each LPS concentration.

