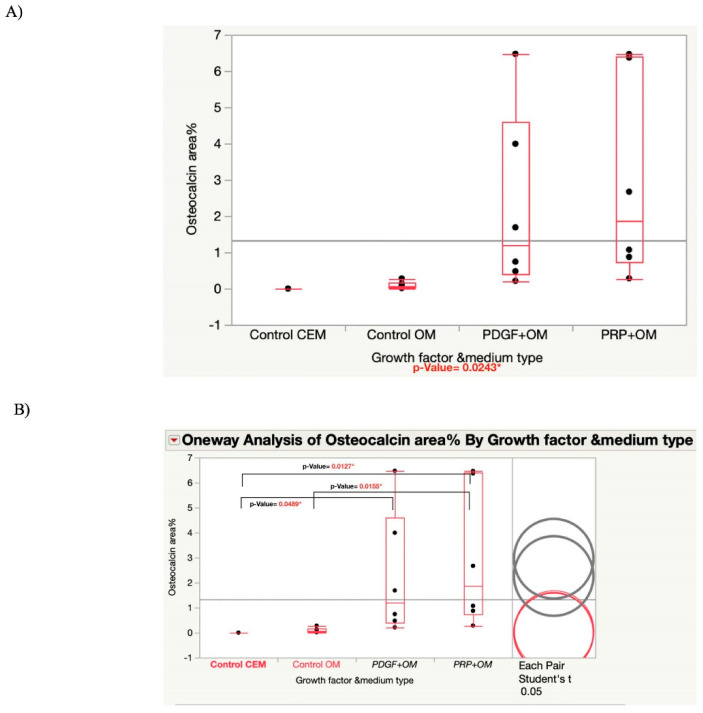
Figure 5.
(A) Graph showing one-way ANOVA analysis of Osteocalcin fluorescence area% among the groups. (B) Graph showing one-way analysis of Osteocalcin fluorescence area% among the groups using pairwise student t-test. Significant differences are shown between the two groups using growth factors compared with the two control groups.

