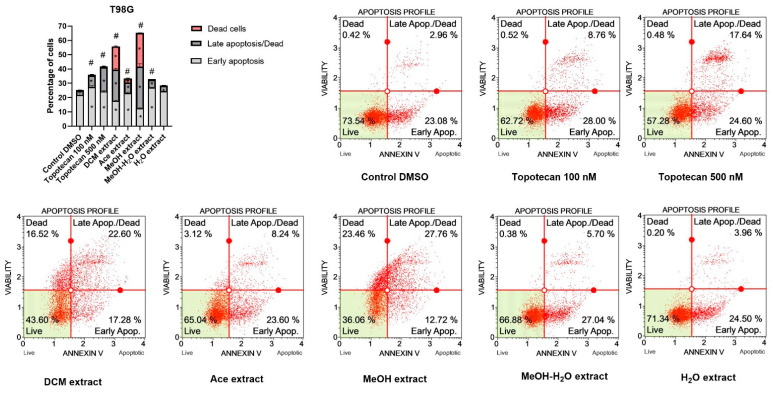
Figure 7.
Apoptosis profiles of T98G cells as studied by the Muse™ Annexin V Dead Cell Kit after 48 h of treatment. Values on the bar chart are shown as mean ± SEM calculated from two independent experiments. (*) indicates statistically significant differences from control group for dead, late apoptosis/dead or early apoptosis cells; (#) above bar indicates statistically significant differences from control group for total apoptotic/dead cells, p 0.05. Representative histograms of controls (DMSO—negative control, topotecan—positive control) and analysed P. glauca extracts are also presented. Each histogram has four quadrant markers, reflecting the different cellular states: the upper left quadrant contains dead cells (necrosis), the upper right has late apoptotic/dead cells (cells that are positive both for Annexin V and for 7-Aminoactinomycin D), the lower left contains live cells and the lower right early apoptotic cells (cells that are positive only for Annexin V).

