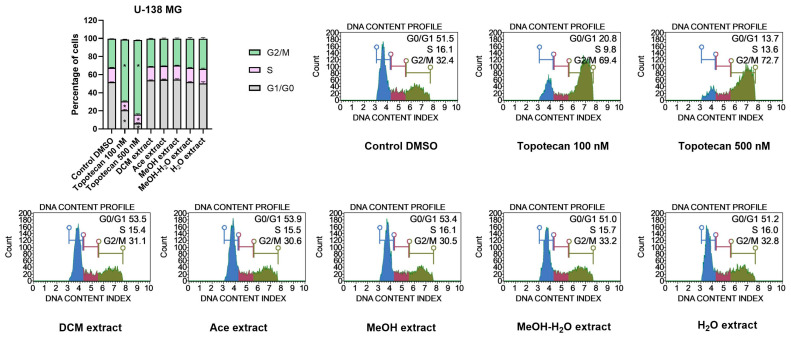
Figure 10.
Cell cycle analysis of U-138 MG cells using the Muse™ Cell Cycle Kit after 48 h of treatment. The percentage of cells in G0/G1, S, and G2/M phases of the cell cycle are presented in the bar chart. The values are shown as the mean ± SEM calculated from two independent experiments. (*) indicates statistically significant differences from the control group for a particular phase, p 0.05. Representative histograms of the controls (DMSO—negative control, topotecan—positive control) and analysed P. glauca extracts are also presented.

