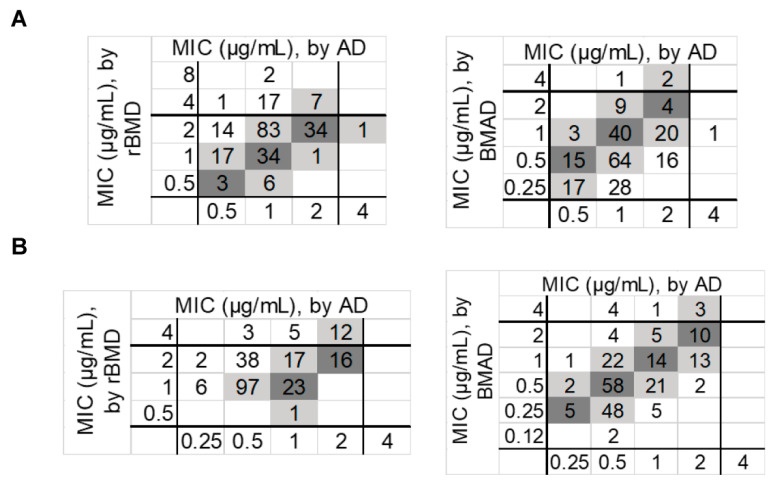
Figure 1.
Scatterplot of MIC values for polymyxin B (A) and colistin (B) measured by AD versus rBMD, and AD versus BMAD using all study isolates (n = 220). The coordinate axis shows the MIC range of the test method. Dark gray, absolute agreement; light gray, essential agreement. BMAD: broth macrodilution; rBMD: reference broth microdilution; AD: agar dilution.

