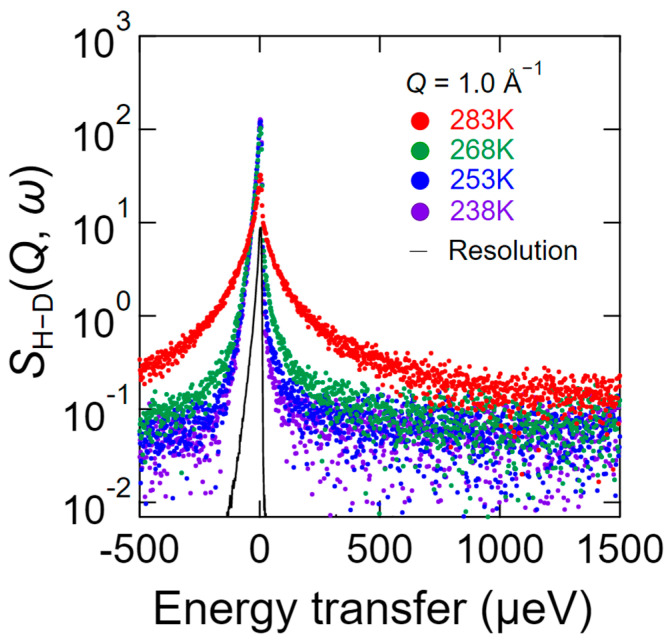
Figure 4.
QENS profiles of SH−D (Q, ω) at Q = 1.0 Å−1 in the energy range of −500 to 1500 μeV with a resolution of 12 μeV at 238 K (purple), 253 K (blue), 268 K (green), and 283 K (red). SH−D (Q, ω) is the scattering intensity that represents the water dynamics of the hydrated chitosan, and is obtained by subtracting SD (Q, ω) from SH (Q, ω), where SH (Q, ω) is the scattering intensity of the chitosan hydrated with H2O and SD (Q, ω) is that of the chitosan hydrated with D2O. The black curve represents the resolution profile of vanadium obtained by QENS.

