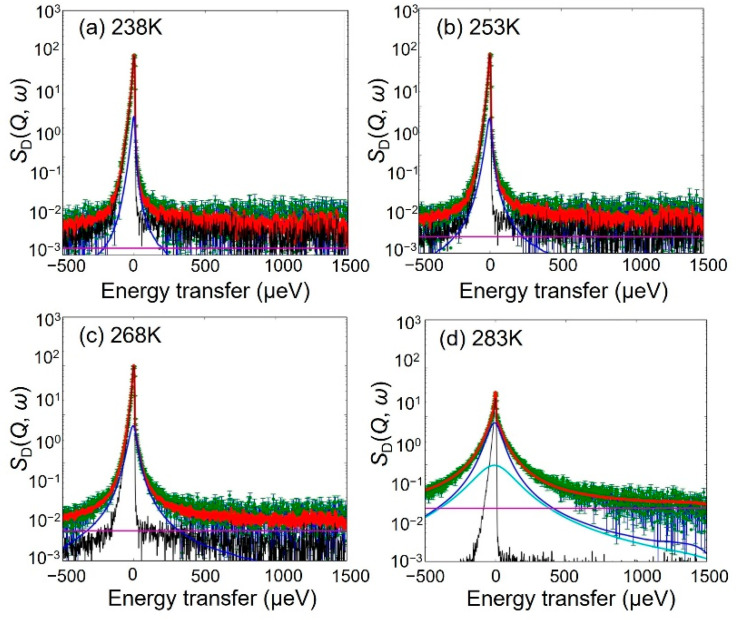
Figure 6.
QENS spectra and fitted results for SH-D (Q, ω) with a resolution of 12 μeV at Q = 1.0 Å−1 and at (a) 238 K, (b) 253 K, (c) 268 K, and (d) 283 K. The green points and the red lines indicate the observed intensities and the fitted curves, respectively. The black, blue, and light blue lines represent the delta, the slow Lorentz function, and the fast Lorentz function, respectively, which are convoluted by the resolution function. The magenta line represents the flat BG.

