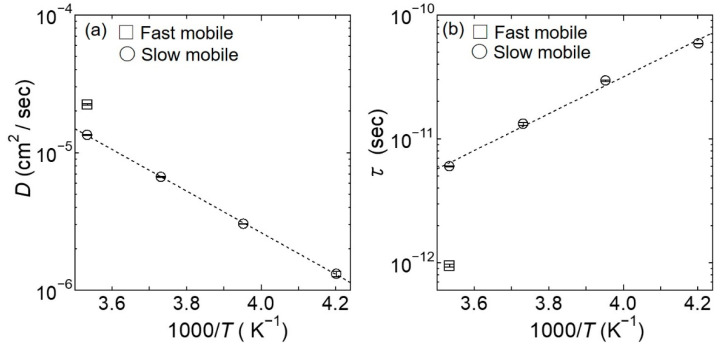
Figure 8.
Arrhenius plots of (a) D and (b) τ for the slow mobile water at 238, 253, 268, and 283 K (depicted as circles), and for the fast mobile water at 283 K (depicted as squares), which were obtained as fitting parameters during analysis based on the jump-diffusion model for Γslow and Γfast. The black dotted lines in the plots of (a) D and (b) τ for the slow mobile water represent the results fitted by the Arrhenius Equation. The errors estimated from the fitting procedure are indicated by bars.

