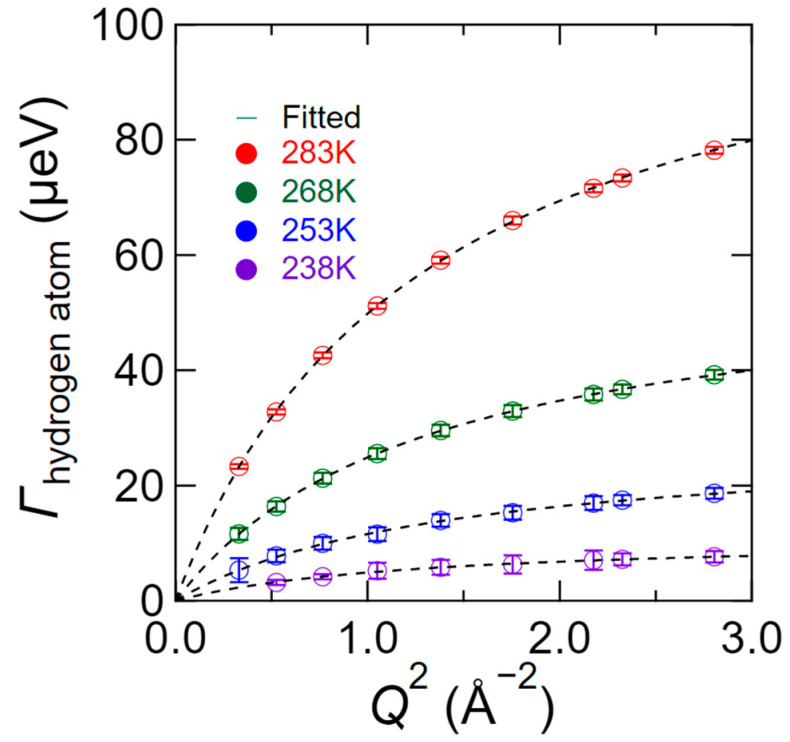
Figure 12.
The Q2-dependence of Γhydrogen atom at 238 K (purple), 253 K (blue), 268 K (green), and 283 K (red) for SD (Q, ω), as obtained by profile fitting to Equation (2). The broken curves on Γhydrogen atom plot represent the fitted results obtained by the jump-diffusion model [30].

