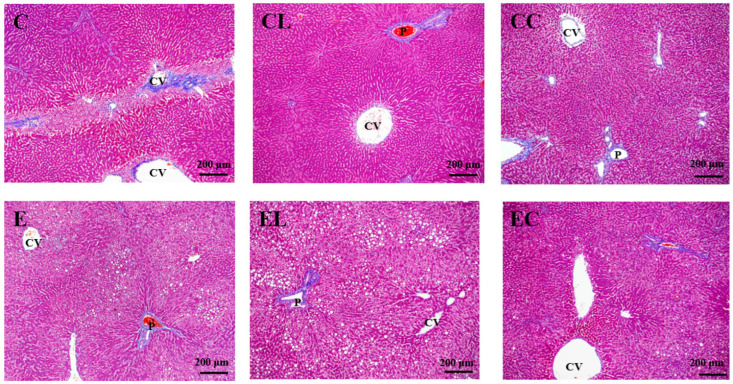
Figure 2.
Effects of different dietary fat sources on Masson’s trichrome staining of liver tissue sections in rats. CV, central vein; P, portal area. C, control group; CL, control diet with lard group; CC, control diet with cocoa butter group; E, ethanol group; EL, ethanol diet with lard group; EC, ethanol diet with cocoa butter group.

